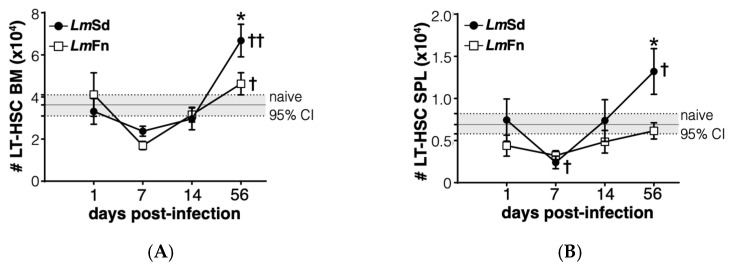
Figure 5.
Long-term HSC-like cells display biphasic kinetics in bone marrow and spleen of LmSd-infected mice. Number of cells expressing LT-HSC markers in (A) bone marrow and (B) spleen at various time points. Graphs represent compiled results (mean ± SEM) from at least 4 independent experiments for each time point, with n = 13, n = 11, n = 11, and n = 15 mice per group (LmFn vs. LmSd) at 1-, 7-, 14-, and 56-days post-infection, respectively. The grey horizontal line and shaded area represent mean ± 95% confidence interval for naïve control mice. * p < 0.05 comparing infection with LmFn vs. LmSd at a given time point and †, †† p < 0.05 comparing infected groups (LmFn or LmSd) to naïve control mice. See also Supplementary Figure S2 for flow cytometry gating strategies and representative results.

