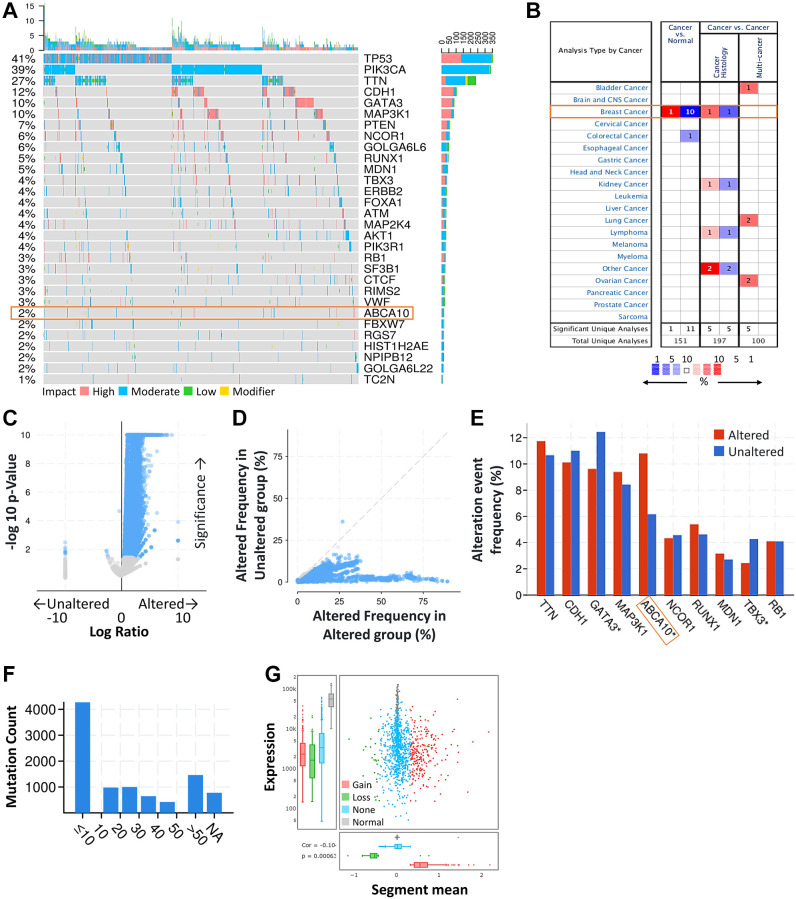
Figure 1.
ABCA10 was significantly mutated in breast cancer compared with normal breast tissue. (A) Waterfall Plot of the top 30 mutated genes from TCGA. The bar plot indicates the number of genetic mutations per patient, while the right bar plot displays the number of genetic mutations per gene. (B) The mRNA expression levels of ABCA10 in multiple cancers on ONCOMINE database. Red background with numbers indicates the studies including ABCA10 expression levels meeting our selection standards (with P-values <0.05 and expression fold changes >1.5-fold change and expressed gene rank in the top 10% as our selection threshold) in cancer tissue; Blue (the same selection threshold) in normal tissues. (C, D) Volcano and scatter and volcano plots exhibiting genes associated with alterations in ABCA10 CNA frequency. (E) Box blot representing the 10 most frequently altered genes. (F) Mutation counts in patients with different kinds of cervical cancer in the TCGA dataset. (G) The distribution and correlation of CNVs are labeled as gains and losses, presented as visual ratios.

