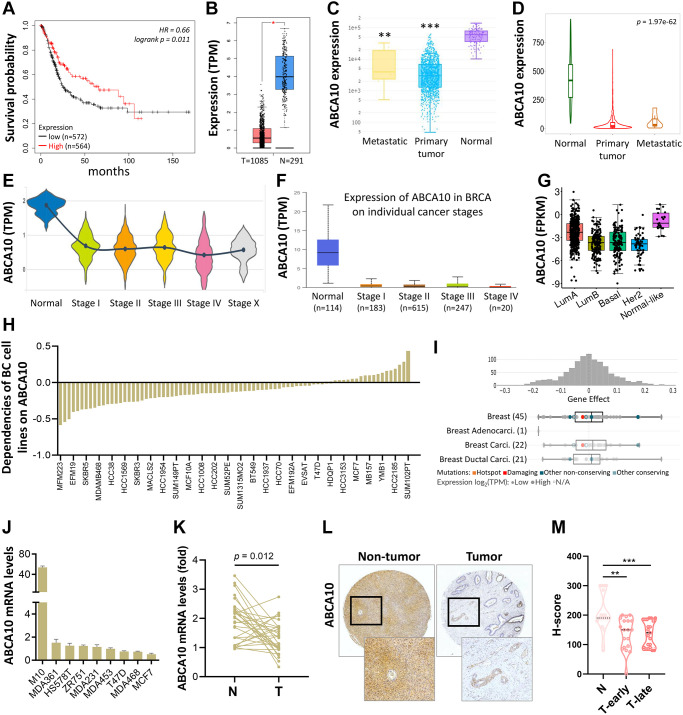
Figure 3.
Transcriptional level of ABCA10 in BRCA. (A) Overall survival estimates for ABCA10 mRNA levels from Kaplan-Meier plotter database. (B) Expression of ABCA10 in BRCA and normal tissues. (C, D) ABCA10 expression in normal, BRCA primary tumor and metastatic tumor from different datasets. Violin (E) and box plot (F) to evaluate ABCA10 mRNA expression in BRCA patients based on pathological stage. (G) The mRNA expression level of ABCA10 among different subtypes of BC from TCGA database. (H, I) Significance of dependency of ABCA10 in 84 BRCA cell lines and different subtypes based on the CRISPR screen. (J) mRNA expression of ABCA10 in normal breast cells and multiple breast cancer cells. (K) qPCR analysis of ABCA10 in 30 paired BRCA and non-tumor tissues. N and T represent non-tumor and tumor tissues, respectively. (L) Representative images of ABCA10 staining in BRCA tissues. (M) IHC scores of ABCA10 expression in BRCA tissues. **P < 0.01, ***P < 0.001.

