Figure 8.
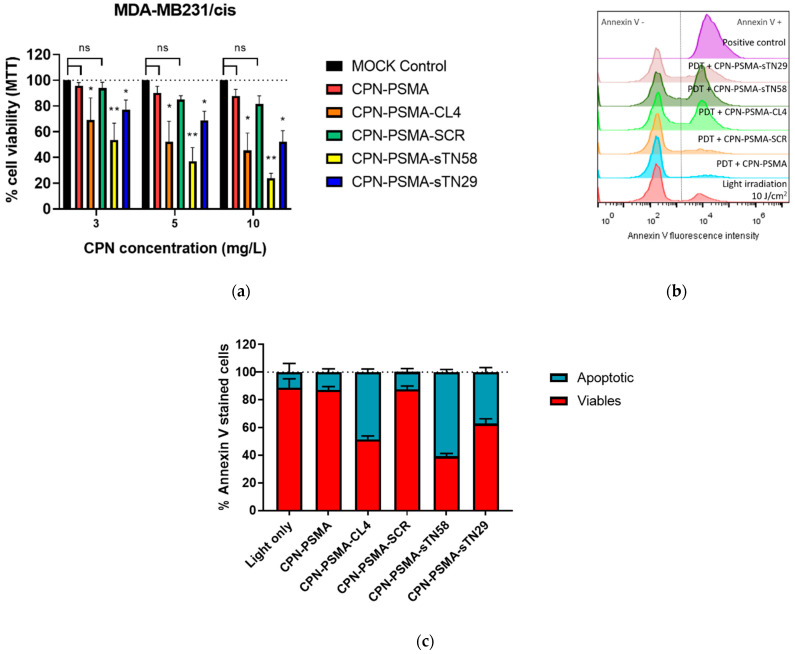
Photodynamic evaluation of aptamer-decorated CPN-PSMA in TNBC cells. (a) Cell viability (evaluated by MTT) after 24 h PDT treatment of MDA-MB-231/cis cell exposed to increased concentration of aptamer-decorated CPNs for 30 min and irradiated with blue light (10 J/cm2). (b) Representative flow cytometry histograms corresponding to apoptosis analysis after PDT treatment (annexin V staining) with aptamer-decorated CPN-PSMA after 6 h post PDT (CPN concentration of 5 mg/L for 30 min and a light dose of 10 J/cm2). (c) Bar graph of percentages of viable and apoptotic cells obtained from experiments described in (b). * p-value < 0.01 and ** p-value < 0.001 with ANOVA test, ns: no statistically significant differences.

