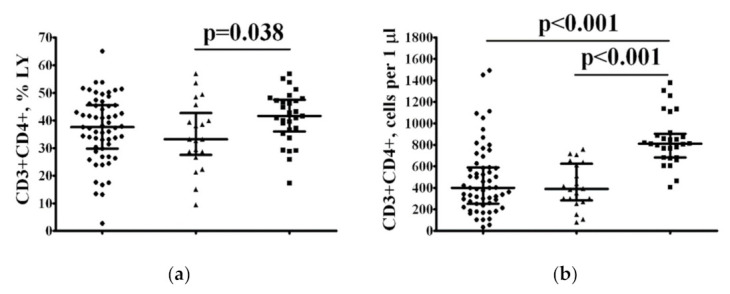
Figure 3.

The frequency of peripheral blood CD3+CD4+ Th cells in patients with COVID-19 and 25(OH)D > 11.4 ng/mL or 25(OH)D ≤ 11.4 ng/mL. Scatter plots show the relative (a) and absolute (b) numbers of CD3+CD4+ T-lymphocytes in peripheral blood samples from patients with COVID-19 and 25(OH)D > 11.4 ng/mL (black circles, n = 59), patients with COVID-19 and 25(OH)D ≤ 11.4 ng/mL (black triangles, n = 20), and HC subjects (n = 28, black squares). Numbers represent the percentages of the indicated Th cell subset among the total lymphocyte population. Each dot represents an individual subject, and the horizontal bars represent the group medians and interquartile ranges (Me [IQR 25; 75]).
