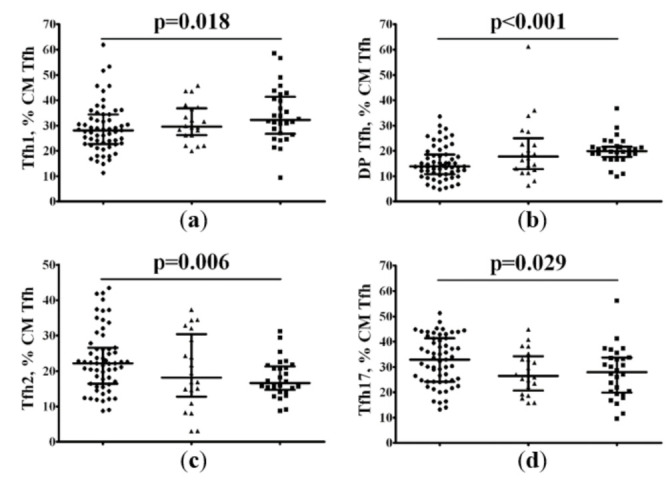
Figure 6.

Imbalance of central memory Tfh cell subsets in patients with COVID-19. Scatter plots show the percentages of CXCR3+CCR6− Tfh1 (a), double-positive CXCR3+CCR6+ Tfh (b), CXCR3−CCR6− Tfh2 (c), and CXCR3−CCR6+ Tfh17 (d) cells among the total CD45RA−CD62L+ Tfh population, respectively, in peripheral blood samples in patients with 25(OH)D > 11.4 ng/mL (black circles), patients with 25(OH)D ≤ 11.4 ng/mL (black triangles), and HC subjects (black squares). Numbers represent the percentage of the indicated Th cell subset among the total lymphocyte population.
