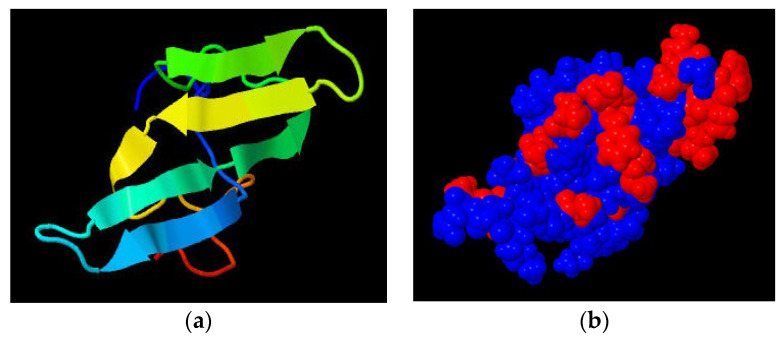
Figure 3.
3D structure (a) and surface properties (b) of soybean Bowman–Birk inhibitor as rendered by Jmol software using the coordinates available in the Brookhaven Protein Data Bank (http://www.rcsb.org/pdb) (accessed on 15 December 2021). Surface color mapping: blue for hydrophilic, red for hydrophobic regions.

