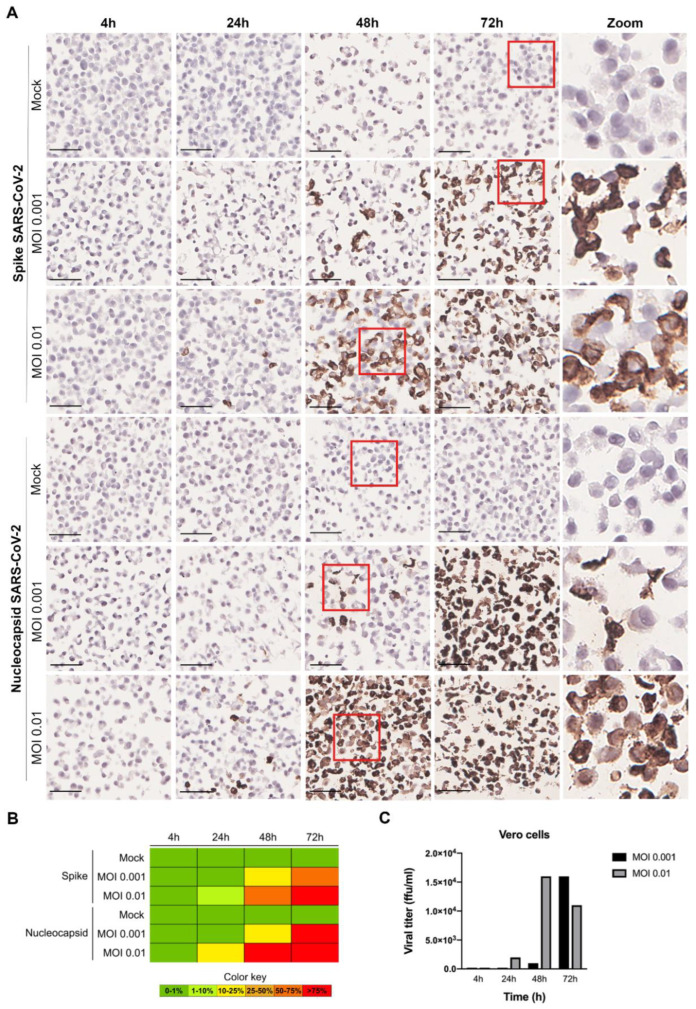
Figure 3.
ICC results for SARS-CoV-2 spike and nucleocapsid proteins in infected Vero cells, at various time points (4 h, 24 h, 48 h and 72 h), for MOI 0.001 and MOI 0.01. (A) Microscopic images with 50 µm scale bar. The last column represents zoomed-in images of the sections highlighted within a red square in the respective rows. Both viral proteins were located in the cytoplasm of the infected cells. (B) Heat map for the percentage of cells stained (0–1%, >1–10%, >10–25%, >25–50%, >50–75%, and >75%). (C) Infectious viral particles produced at the various time points (in ffu/mL—focus forming units per mL).

