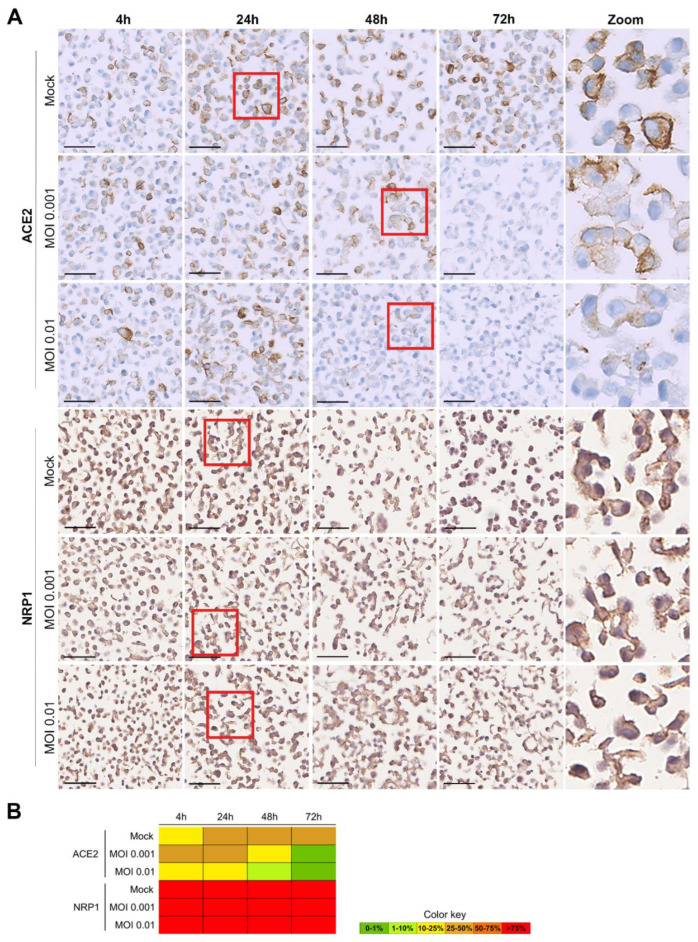
Figure 4.
ICC results for ACE2 and NRP1 proteins in SARS-CoV-2-infected Vero cells, at various time points (4 h, 24 h, 48 h and 72 h), for mock (non-infected), MOI 0.001 and MOI 0.01. (A) Microscopic images with a 50 µm scale bar. The last column represents zoomed-in images of the sections highlighted within a red square in the respective rows. Both viral proteins were located in the cytoplasm of the infected cells. ACE2 was localized in the membrane, and NRP1 in the membrane and in the cytoplasm. (B) Heat map for the percentage of cells stained (0–1%, >1–10%, >10–25%, >25–50%, >50–75%, and >75%).

