Figure 5.
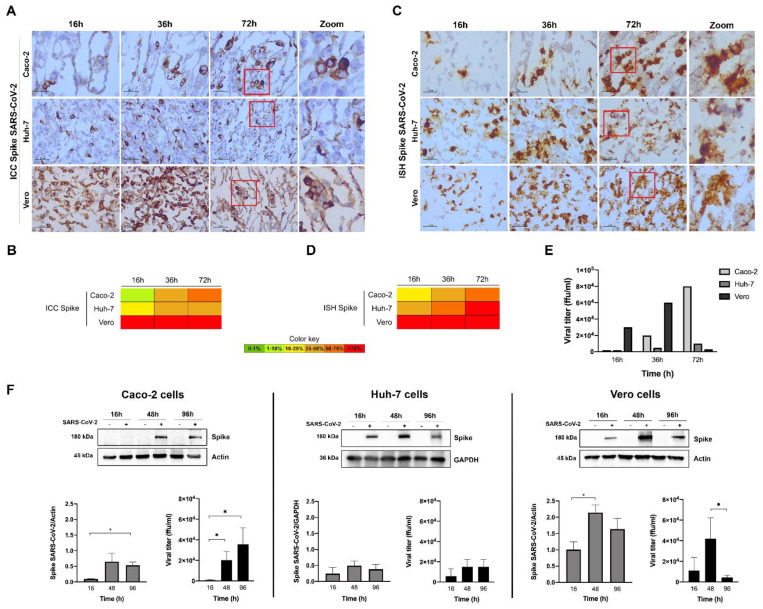
Characterization of SARS-CoV-2 spike expression in the human (Caco-2 and Huh-7) and Vero cell lines, at various time points after infection with MOI 1, by ICC ((A) microscopic images with 100 µm scale bar, including zooms of the red inserts; (B) heat map), and ISH ((C) microscopic images, including zooms of the red inserts; (D) heat map). The spike protein had a cytoplasmic location in all the infected cell lines. (E) Infectious viral particles produced at the various time points (in ffu/mL—focus forming units per mL). (F) Western blots and graphs representing the spike quantification in cells and the infectious viral particles produced in these independent experiments. In the graphs, data represent means ± SD of three independent experiments, and significant Student’s t-test p-values are indicated (* < 0.05).

