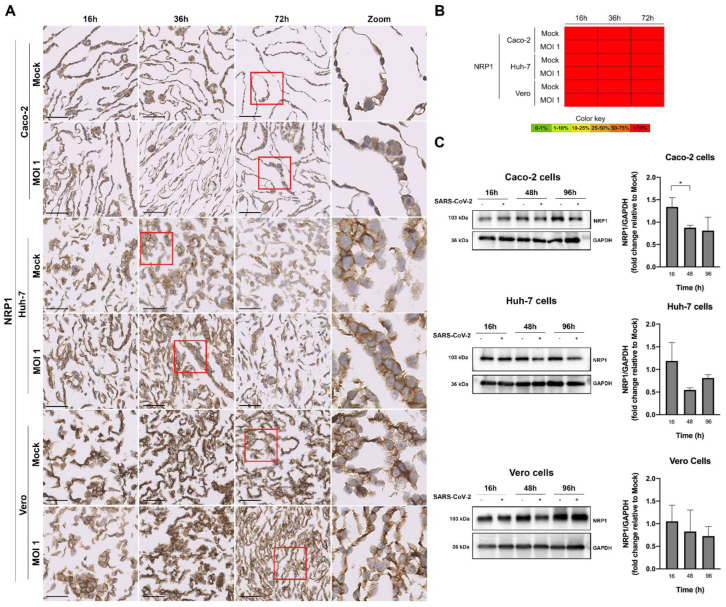
Figure 7.
Characterization of NRP1 expression in the human (Caco-2 and Huh-7) and Vero cell lines, at various time points after infection with MOI 1, by ICC ((A) microscopic images with 50 µm scale bar, including zooms of the red inserts; (B) heat map) and Western blot (C). In the graphs, data represent means ± SD of three independent experiments, and significant Student’s t-test p-values are indicated (* < 0.05). The NRP1 was expressed in the membrane and in the cytoplasm of all the infected cell lines.

