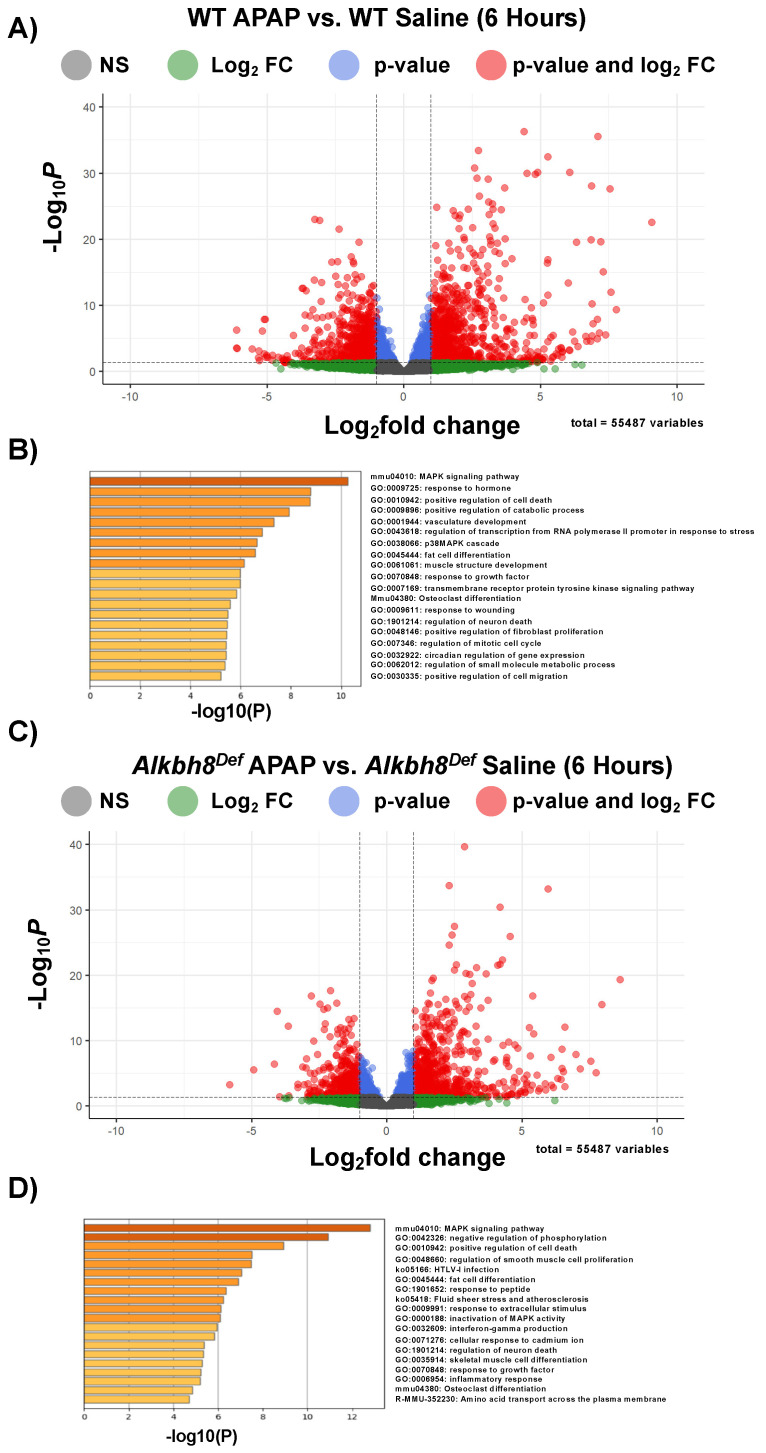
Figure 2.
Next-generation mRNA sequencing analysis of the transcriptional response to APAP. WT and Alkbh8Def mice (N = 3) were left untreated or exposed to a single dose of APAP and livers were harvested after 6 h and RNA was purified and subject to mRNA-seq. Enhanced volcano plots from mRNA-seq data were generated for each of the comparisons and metascape analysis were performed for log2 FC > 2.0 and padj. values ≤ 0.05 for (A,B) WT APAP vs. WT Saline and (C,D) Alkbh8Def APAP vs. Alkbh8Def Saline.

