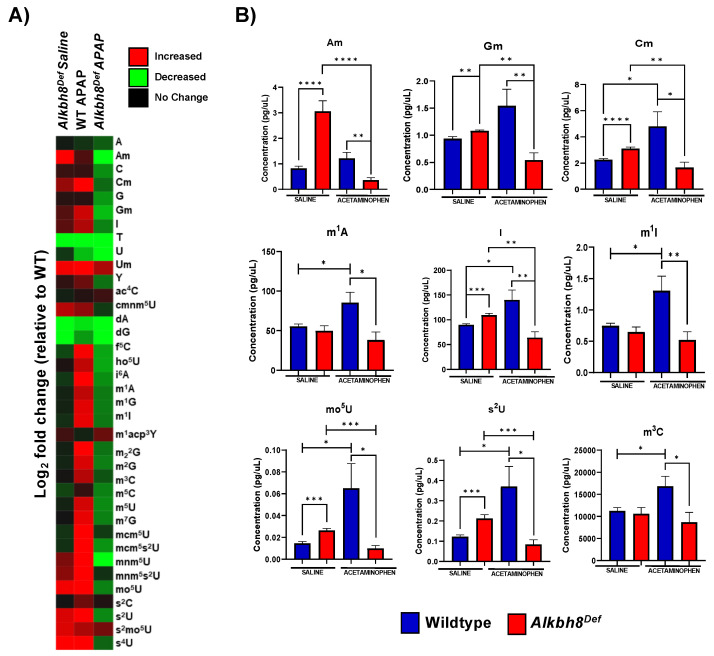
Figure 5.
The epitranscriptome is differentially regulated in WT and Alkbh8Def livers in response to a single dose of APAP. (A) 37 epitranscriptome marks were measured with LC-MS/MS and the log2fold change was normalized relative to WT saline data and shown as a heat map. (B) Data for each modification under the four conditions was compared for statistical significance (N = 3) using an unpaired t-test with (* p < 0.05, ** p < 0.01, *** p < 0.001 and **** p < 0.0001).

