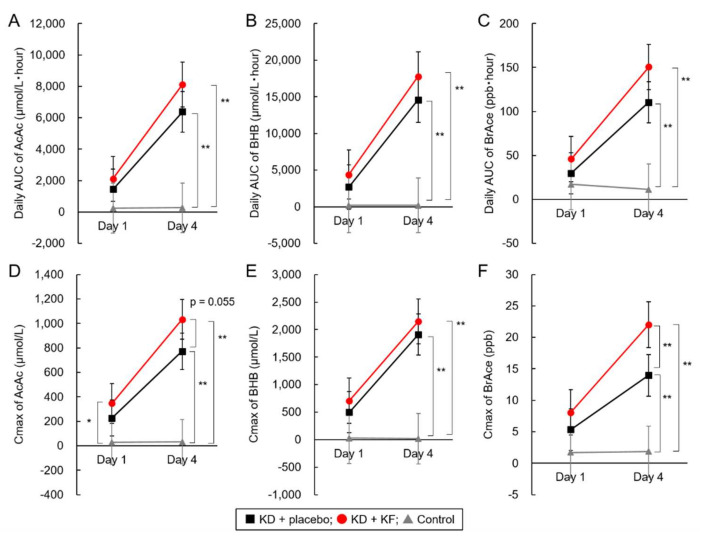
Figure 5.
Analysis of the results of secondary endpoints. AUC of plasma AcAc (A), BHB (B), and breath acetone (C) concentrations, and the maximum concentration of plasma AcAc (D), BHB (E), and breath acetone (F). *: p < 0.05, **: p < 0.01, Tukey–Kramer’s test. All parameters in KD + placebo group and KD + KF group changed significantly between Day 1 and Day 4 (p < 0.05).

