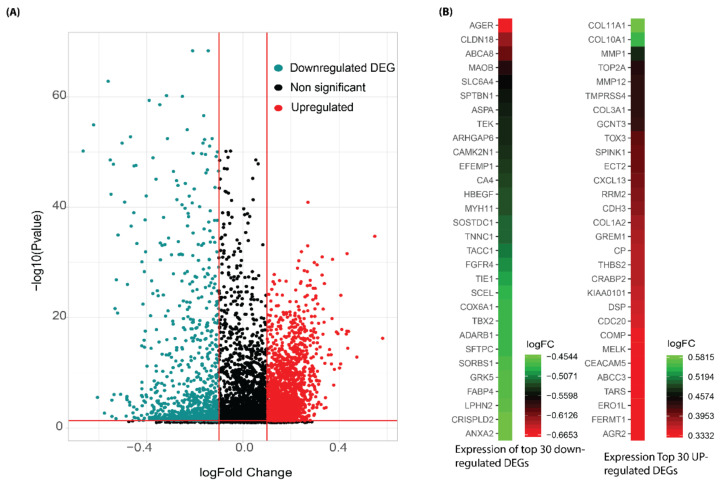
Figure 2.
(A) Volcano plot distribution highlighting 2700 meta-DEGs between normal and tumor samples. The red and cyan colored points denote the up (1842) and downregulated (858) meta-DEGs. All the black colored points denote non-significant genes. The x and y axes represent the log2FC and −log10 p-value, respectively. (B) The heatmap denotes the gene expression of top-30 downregulated and upregulated and DEGs based on fold changes. DEGs identification with the volcano plot in a microarray represented the top DEGs in lung cancer cases and controls. The top DEGs follow the logFC value and p-value criterion.

