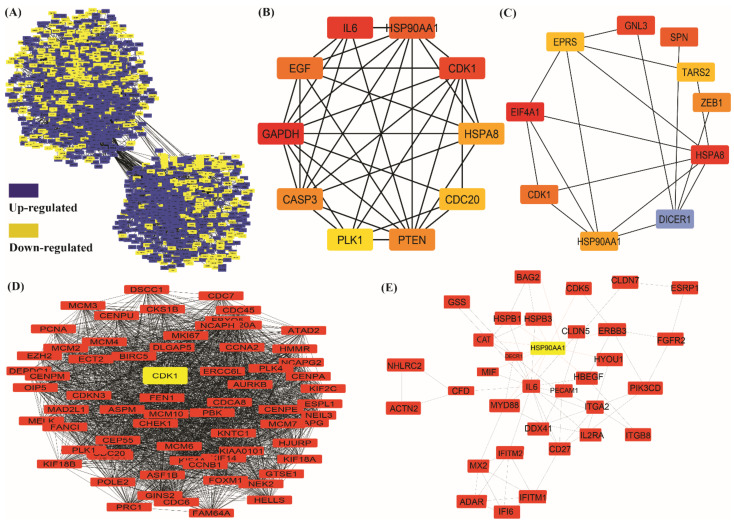
Figure 5.
(A) Protein–protein network of DEGs. Blue color node showing upregulated genes and yellow color node showing downregulated genes of non-small cell lung cancer vs. normal. (B) Top-10 hub, and (C) bottleneck genes of PPI network retrieved from significant modules (dark color showing higher value in analysis, all are upregulated except the blue which represents downregulated genes) (D,E) Top-two modules after integrated analysis of PPI network (D) Modules 1 (E) Module 2. Node showing genes, lines denoted interaction between genes.

