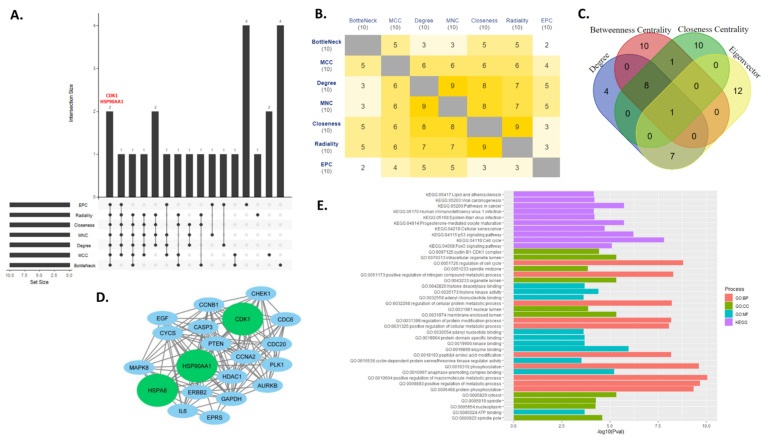
Figure 7.
(A) Identifying common genes among seven topological properties. The first bar in the upset plot denotes two genes CDK1 and HSP90AA1 are common among top ten genes of each of the seven topological parameters. (B) Mutual intersections of each of the seven topological properties are shown as heat maps. (C) Intersections among top twenty genes having highest degree, betweenness centrality, closeness centrality and eigenvector values. (D) regulatory network of top 20 hub genes (top twenty genes ranked by degrees). (E) p-values are used to color a bar graph of enriched terms for a regulatory network of top-20 hub genes.

