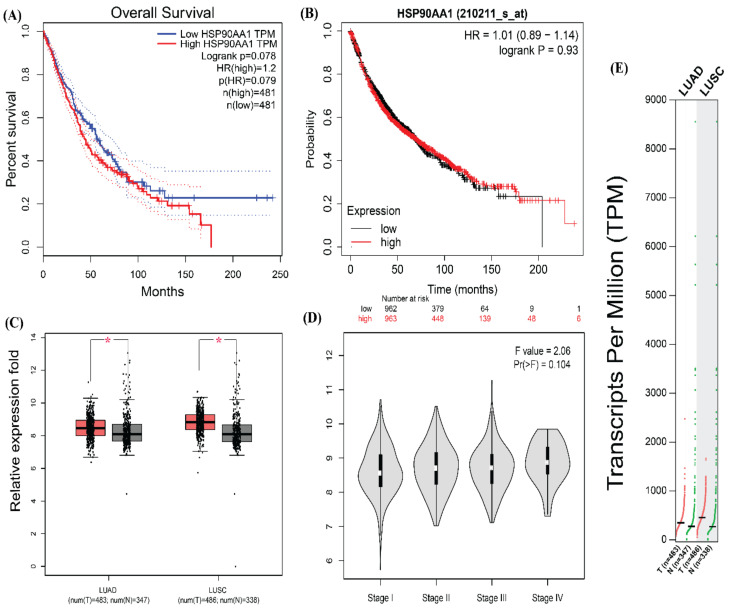
Figure 9.
The survival, expressional and pathological analysis of HSP90AA1. (A) Survival plot for HSP90AA1 obtained from GEPIA (gepia.cancer-pku.cn). (B) Survival plot of HSP90AA1 from KM-Plotter. (C) Expression profile of HSP90AA1 in normal (grey) and tumor (red) samples of LUAD and LUSC datasets (p < 0.05) (D) Pathological stage condition for HSP90AA1 genes using LUAD and LUSC datasets. (E) Expression of HSP90AA1 gene based on RNA-seq data from the TCGA database assessed by TPM (Transcripts per million) from GEPIA. (Survival analysis is done in GEPIA using log-rank test (Mantel–Cox test), for the hypothesis evaluation.) One * (star) signifies p value less than 0.05. It is updated in the text. One * (star) signifies p value less than 0.05. It is updated in the text.

