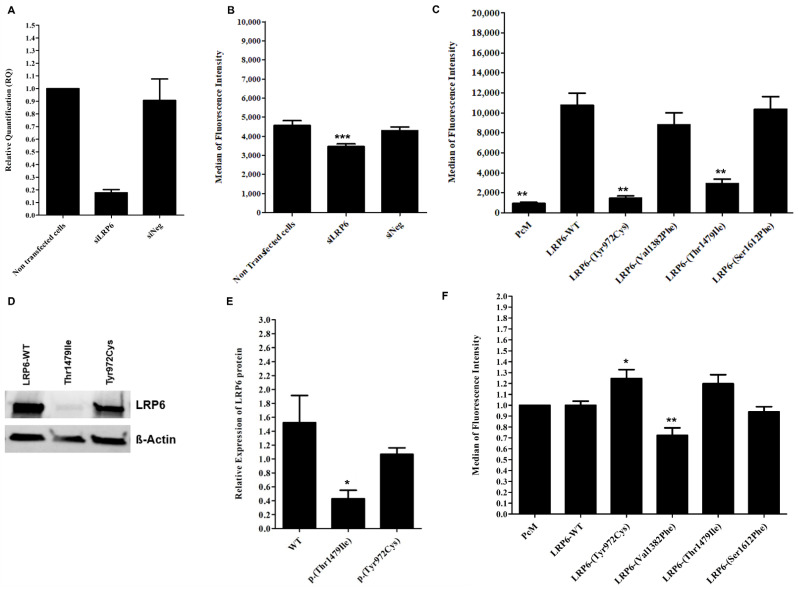
Figure 4.
Effect of inhibited, overexpressed or mutated LRP6 in HEK293T and HuH7 cells. (A) LRP6 mRNA expression in HuH7 after the silencing of LRP6. Reactions were run in triplicate for each cDNA. POLR2A was used as the reference housekeeping gene. The relative quantification of gene expression was performed using the ∆∆CT method and non-transfected cells were used for calibration. (B) LDL-Bodipy uptake in HuH7 after silencing of LRP6. Median fluorescence intensity of 50,000 events was acquired for each sample, but only the median fluorescence intensity of living cells is presented. Data represent three independent assays performed in triplicate. (C) Expression of WT or mutated LRP6 at the cell surface of transfected HEK293T. The median fluorescence intensity of 100,000 events was acquired for each sample, but only the median fluorescence intensity of living cells is presented. Data represent four independently performed assays. (D,E) LRP6 expression in HEK293T cells after transfection with LRP6-WT or mutated plasmid (p.(Thr1479Ile) and p.(Tyr972Cys) variants). Proteins were extracted from transfected cells, separated by electrophoresis and then transferred onto PVDF membrane. The membrane was incubated with primary antibody (anti-LRP6), followed by incubation with secondary antibody before detection using the iBrightTM FL1500 imaging system. Protein was quantified by ImageJ software. Equal loading was confirmed using the ß-actin antibody. Data represent three independent assays. (F) LDL uptake in HEK293T after transfection with an empty vector, LRP6-WT or mutated plasmid. The median fluorescence intensity of 100,000 events was acquired for each sample, but only the median fluorescence intensity of living cells is presented. The fluorescence of each sample was normalized using the empty vector (PcM) as a reference. Data represent three independent assays, each performed in triplicate. In all experiments, the difference between conditions was determined by Bonferroni’s Multiple Comparison Test in one-way ANOVA and * p < 0.05, ** p < 0.01, *** p < 0.001 were considered as statistically significant. Results are shown as mean ± SD. Error bars represent ± SD.

