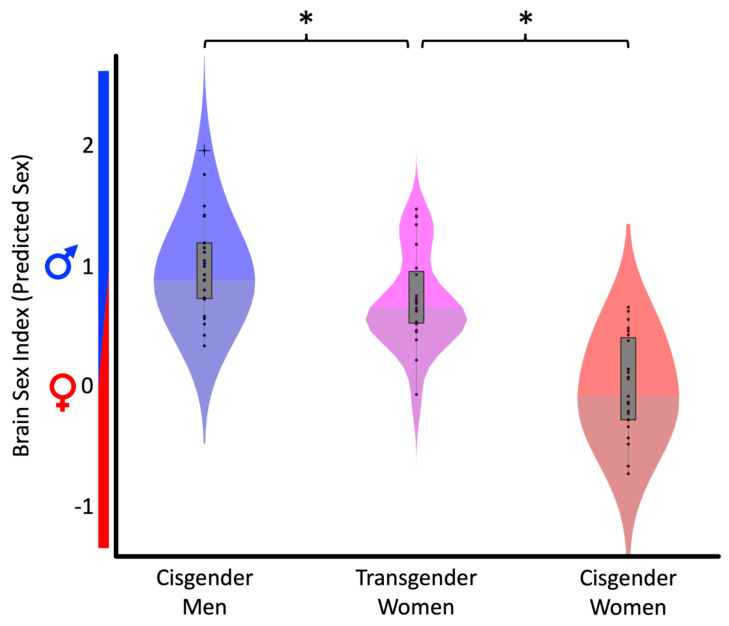
Figure 1.
Significant Group Differences in estimated Brain Sex. The x-axis refers to the three groups. The y-axis displays the estimated Brain Sex (0 = average female; 1 = average male). Data are displayed as violin plots for cisgender men (blue), transgender women (pink), and cisgender women (red). The gray center of each violin contains the values between the 25th and 75th percentiles, the 24 black oval markers correspond to the 24 brains in each group, and the ‘+’ marks a brain that is outside the 1.5 interquartile range (vertical gray lines). The asterisks indicate significant group differences.

