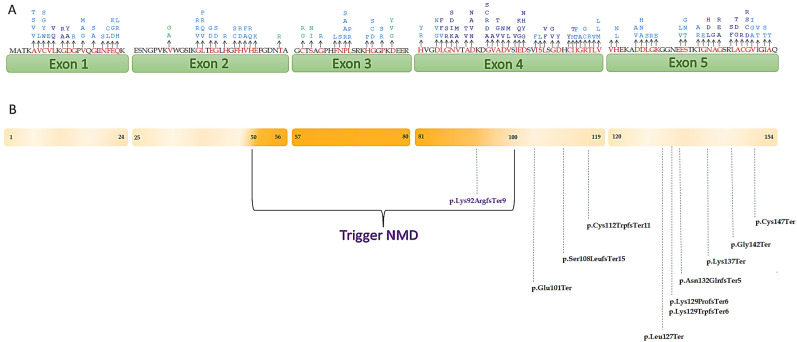
Figure 1.
(A) Schematic representation of SOD1 showing the localization of variants that were assigned PM1. The amino acid changes are represented in red. The different weights of the criterion are represented by the different colors: dark blue, PM1_Strong; light blue, PM1_Moderate; green, PM1_Supporting. The numbers under the exons represent the amino acid distribution; (B) localization of variants that undergo/do not undergo NMD. The variants localized in SOD1 region where PTCs trigger NMD are represented in purple, the variants localized in the region that do not undergo NMD are colored in black.

