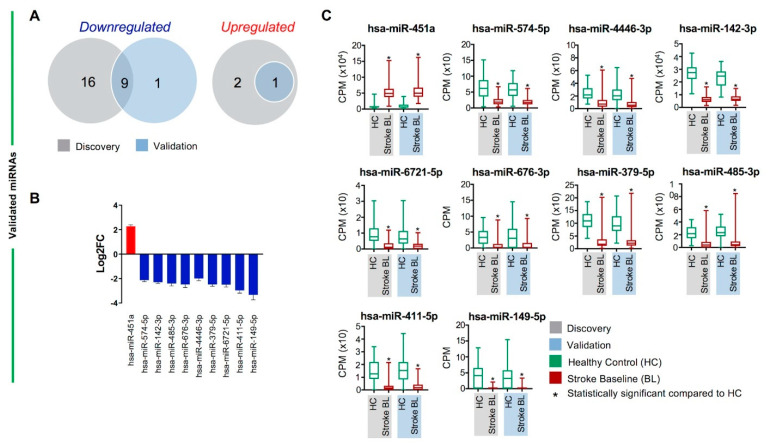
Figure 3.
Validated differentially regulated circulating miRNAs between stroke baseline patients and healthy controls. (A) Venn diagram shows the total number of overlapping downregulated and upregulated miRNAs in the stroke baseline versus healthy control comparison between discovery (gray) and validation (light blue) cohorts. (B) Column graph shows the Log2FC + standard error of the mean (SEM) of 1 upregulated and 9 downregulated validated miRNAs. (C) Box and whiskers plots show the difference in counts per million (CPM) in stroke baseline (BL) and healthy controls (HC) in discovery (gray) and validation (light blue) cohorts of the 10 differentially regulated, validated miRNAs in stroke BL versus healthy controls. Mean with minimum and maximum values, and upper and lower quartiles are depicted for each data set with significant comparisons annotated by an asterisk (*) on top (p < 0.0001).

