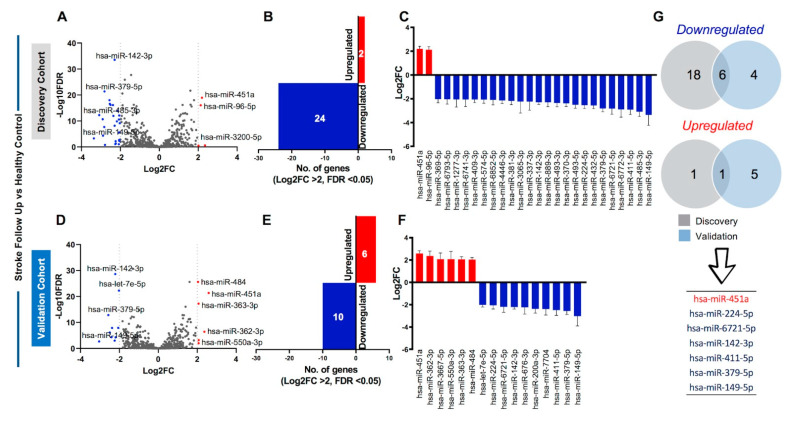
Figure 5.
Circulating miRNA profiling of stroke follow-up patients compared with healthy controls. (A) Volcano plot shows overall differentially regulated miRNAs in stroke follow-up patients from the discovery cohort; red dots represent upregulated, blue represent downregulated, and gray dots represent unchanged miRNAs based on significance (FDR < 0.05) and log2FC > 2 (dotted vertical lines). (B) Bar plot represents the number of upregulated (red bar) and downregulated (blue bar) miRNA using the specified cutoffs. (C) Column graph shows the Log2FC + standard error of the mean (SEM) of the 2 upregulated and 24 downregulated miRNAs in the discovery cohort. (D) Volcano plot, (E) bar plot, and (F) column graph show the 6 upregulated and 10 downregulated miRNAs in the validation cohort. (G) Venn diagram shows the total number of overlapping 6 downregulated and 1 upregulated miRNA in the stroke follow up versus healthy control comparison between discovery (gray) and validation (light blue) cohorts. The 7 validated miRNAs are also listed.

