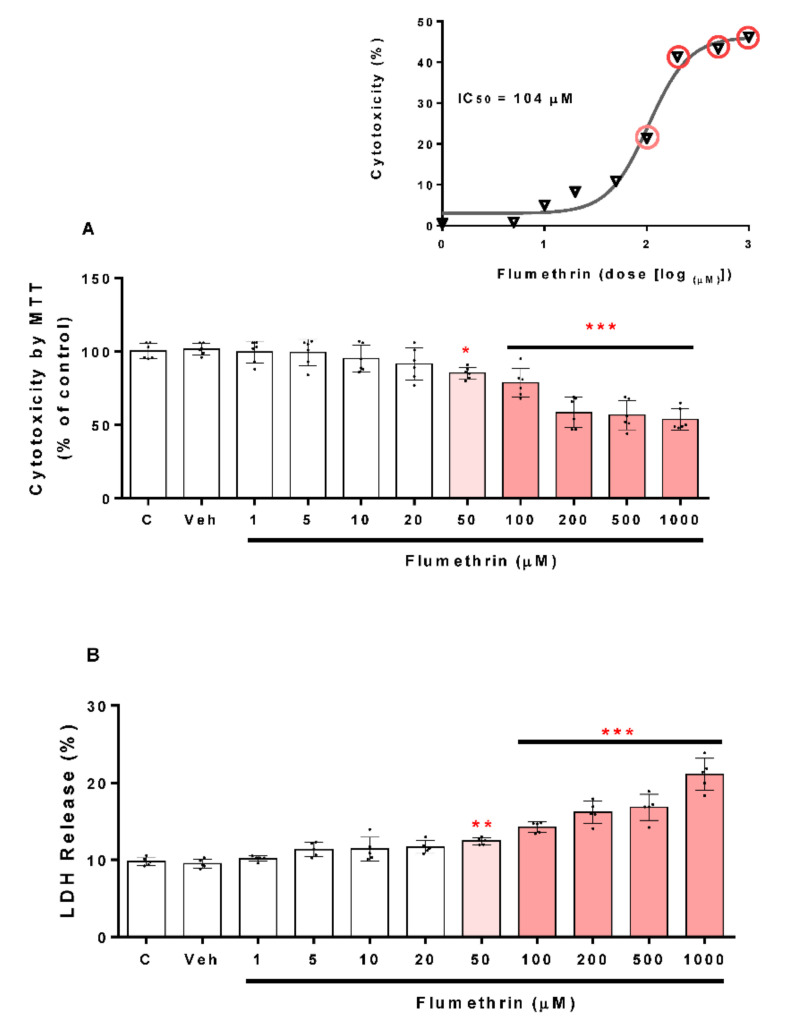
Figure 1.
The cytotoxicity induced by flumethrin (1–1000 µM) on the viability of the SH-SY5Y cell line after a 24 h incubation period. Cell viability was determined by MTT reduction, and the MTT reduction (%) dose-response curve was used to obtain the IC50 value (A), or as LDH release (B). Data was normalized as % control (c). DMEM-treated cells with 1% FBS were the positive control (c), and cells with 0.1% DMSO were the negative control (Veh). Results are presented as the mean ± SD of six replicates. * p < 0.05, ** p < 0.01, *** p < 0.001 compared to Veh.

