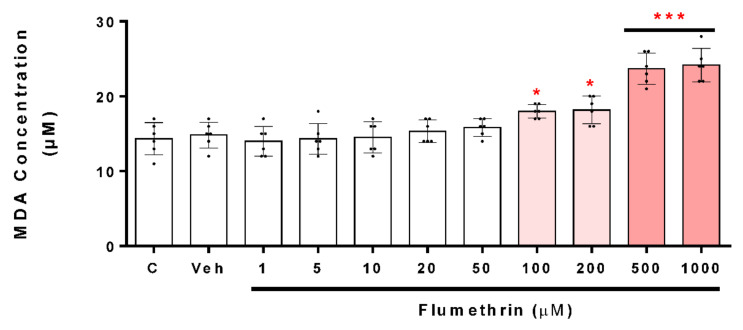
Figure 4.
The MDA production induced by flumethrin (1–1000 µM) in SH-SY5Y cells after a 24 h incubation period. The content of MDA (µM) was calculated for each sample from a standard curve. DMEM-treated cells with 1% FBS were the positive control (c), and cells with 0.1% DMSO were the negative control (Veh). Results are presented as the mean ± SD of six replicates. * p < 0.05, *** p < 0.001 compared to Veh.

