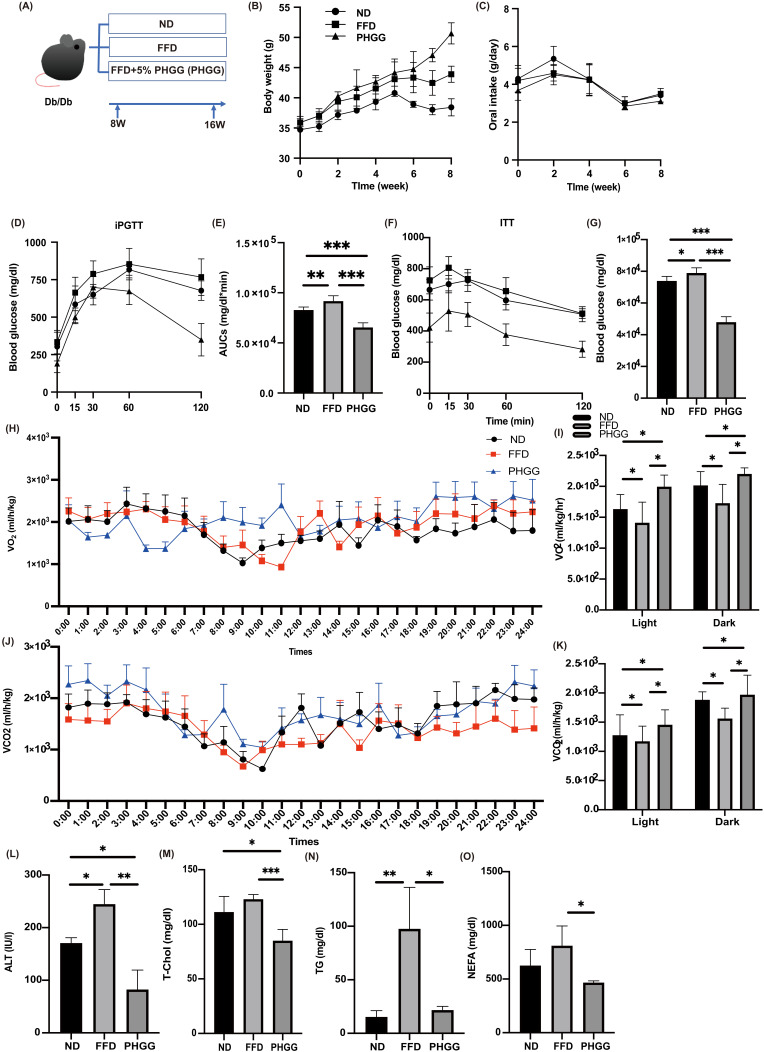
Figure 1.
The administration of PHGG improved glucose tolerance, increased energy and metabolism, and improved hepatic enzymes and lipid metabolism. (A) Administration of PHGG (5% per feed weight) started at 8 weeks. (B) Changes in body weight (n = 6). (C) Changes in oral intake (n = 6). (D,E) Results of intraperitoneal glucose tolerance test (2 g/kg body weight) for 15-week-old mice and area under the curve (AUC) analysis (n = 6). (F,G) Results of insulin tolerance test (0.75 U/kg body weight) for 15-week-old mice and AUC analysis (n = 6). (H) Real-time monitoring curve of oxygen consumption (VO2) (n = 6). (I) Quantification of O2 consumption (n = 6). (J) Real-time monitoring curve of carbon dioxide release (VCO2) (n = 6). (K) Quantification of carbon dioxide release (n = 6). (L–O) Serum alanine aminotransferase (ALT), total cholesterol (T-Chol), triglyceride (TG), and non-esterified fatty acid (NEFA) levels (n = 6). Data are presented as mean ± SD. * p < 0.05, ** p < 0.01, *** p < 0.001, as determined by one-way ANOVA.

