
Fig. 1.
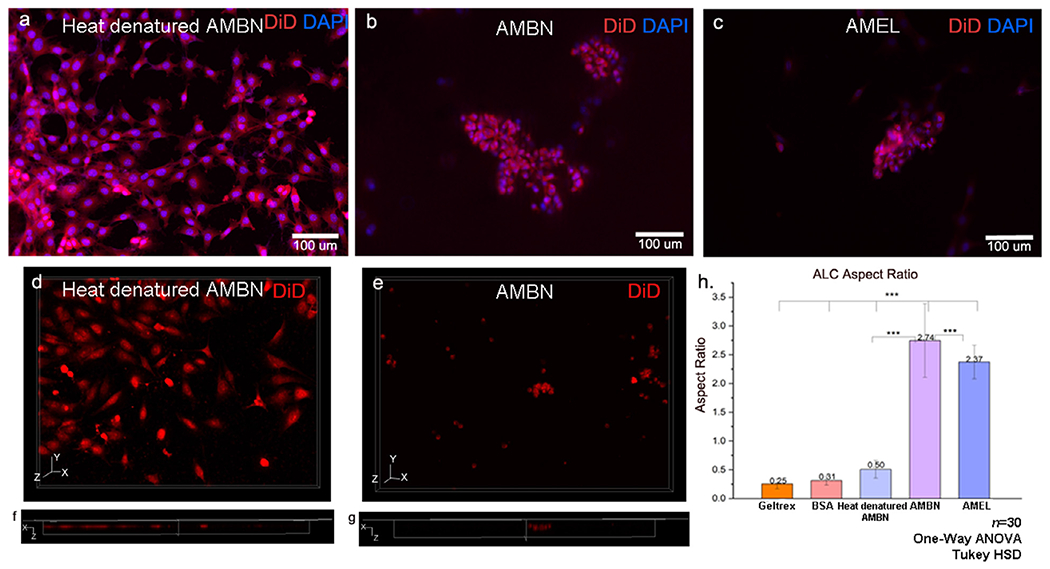
ALC form 3D clusters of elongated cells in the presence of amelogenin and ameloblastin in GFR-Geltrex. XY surface morphology of the cells in the presence of (a) heat denatured AMBN (negative control), (b) AMBN, (c) AMEL. Note the characteristic clustering of cells in b and c whereas cells remain discrete in a. (d, e) three-dimensional reconstruction of Z stacks from control and test groups and (f, g) orthogonal axial sections of the Z stacks. Note the presence of flat cells without significant height in Z direction in (f) negative control. (g) elongated cells within the clusters in AMBN. ALC aspect ratio comparison between control, BSA, heat denatured AMBN and tests (AMBN and AMEL). * One-way ANOVA; Tukey HSD; p<0.05; ** p<0.01; *** p<0.001.