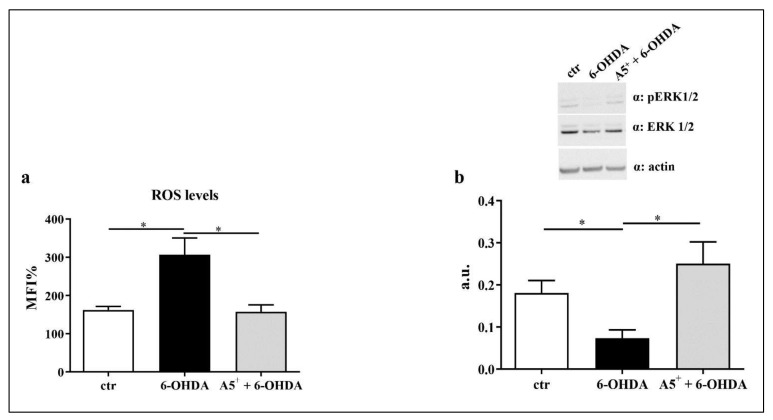
Figure 6.
A5+-mediated antioxidant effect. (a) ROS production assessed by cytofluorimetric analysis. (b) pERK/1/2 levels. Data are reported as mean ± SEM. Graphs represent one of three separate studies, all yielding similar results (n = 4). (* p < 0.05). ctr: control; 6-OHDA: 6-hydroxydopamine. a.u. = arbitrary unit.

