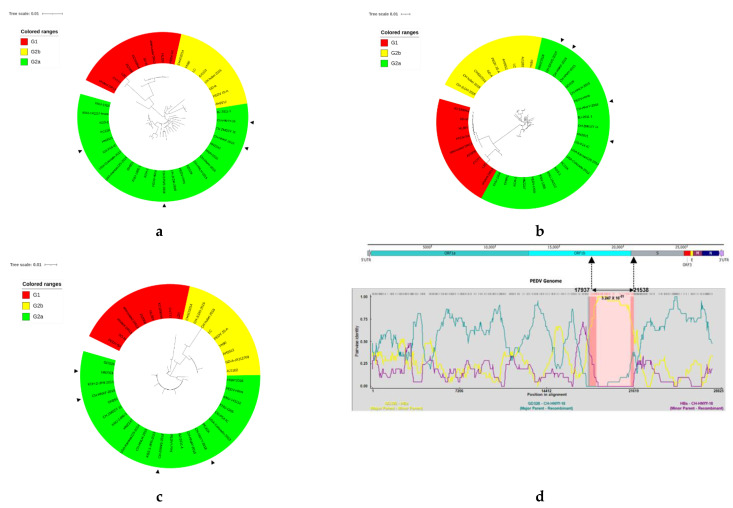
Figure 3.
Genotyping and recombination analysis of the 41 PEDV strains in the present study based on different genes. Phylogenetic trees were constructed based on the aligned full-length genomic sequences (a), S gene (b) and ORF3 gene (c) by using the neighbor-joining method from MEGA 7.0, with 1000 bootstrap replicates. The trees were drawn to scale, with branch lengths measured in the number of substitutions per site. Group 1, G2a subgroup and G2b subgroup are colored in red, green and yellow, respectively. The triangle symbols represent the strains obtained in this study. (d) Recombination analysis of CH-HNYY-2018 with indicated PEDV strains. The result was described using the RDP method which was supported by >6 programs to further characterize the potential recombination events. The black arrow indicates the regions where a recombination event may occur.

