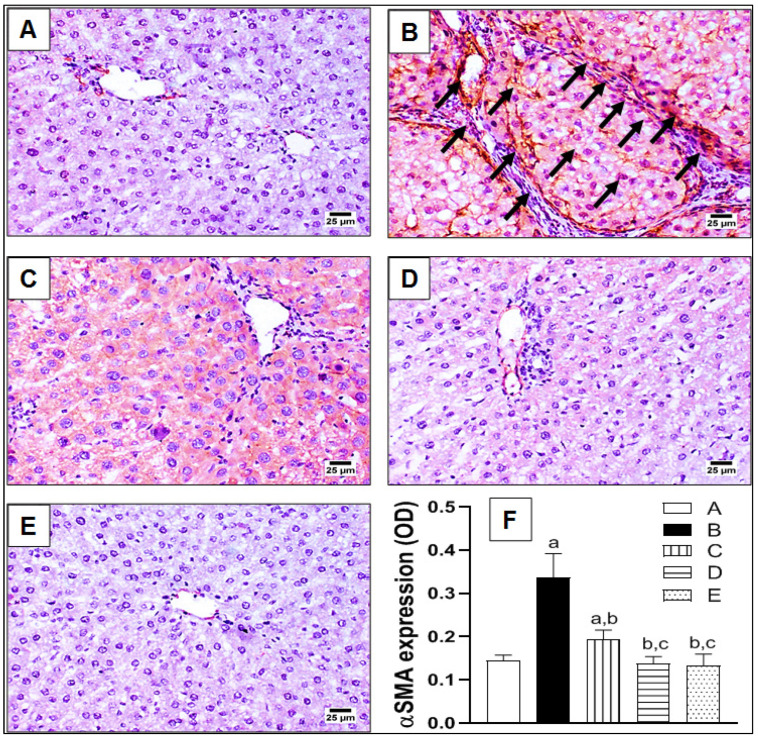
Figure 3.
The effect of lycorine on expression of α smooth muscle actin (αSMA) by immunohistochemical staining in a rat model of TAA-induced liver fibrosis. (A) Control group; (B) TAA-challenged group; (C,D) lycorine-treated groups at doses 0.5 and 1.0 mg/kg, respectively; (E) lycorine-alone group; (F) quantitative image analysis for αSMA immunohistochemical staining, as optical density (OD) across six different fields. Data are presented as mean ± S.D. (n = 6). (a), (b), (c) Statistically significant from the control, TAA, and TAA + lycorine 0.5 mg/kg/d groups, respectively, at p < 0.05 using one-way analysis of variance (ANOVA) followed by Tukey’s as a post-hoc test.

