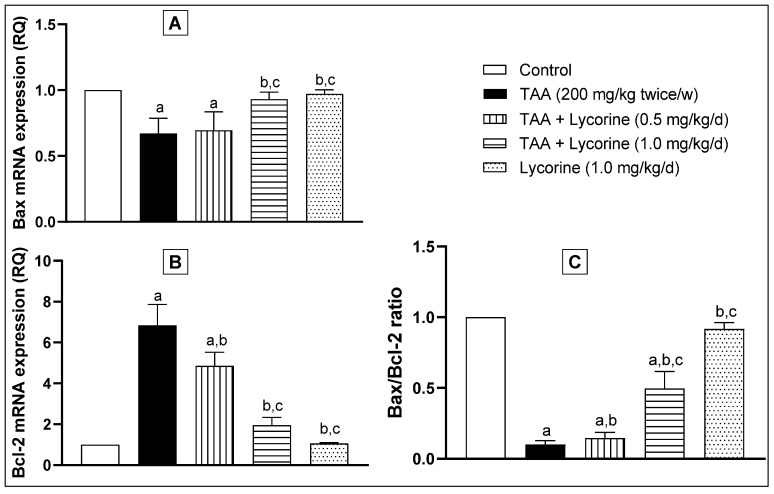
Figure 8.
The effect of lycorine on the quantitative RT-PCR of (A) Bax and (B) Bcl-2 mRNA expression, expressed as relative quantitation (RQ), and the (C) Bax/Bcl-2 ratio. Data are presented as mean ± S.D. (n = 6). Statistical analysis was carried out by one-way ANOVA followed by Tukey’s post-hoc test. (a) Statistical significance from the corresponding control at p < 0.05. (b) Statistical significance from the TAA-challenged group at p < 0.05. (c) Statistical significance from the TAA + lycorine 0.5 mg/kg/d group at p < 0.05.

