Figure 2.
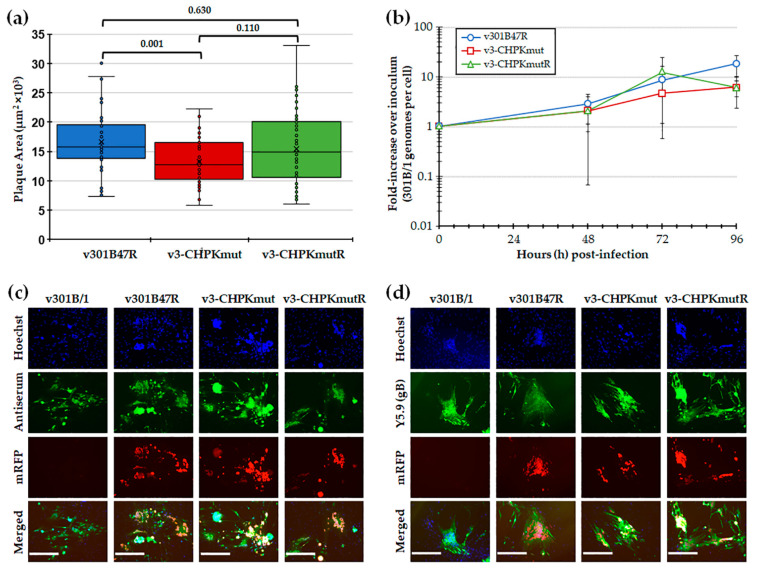
Replication in tissue culture cells. (a) Mean plaque areas (n = 50) of viruses reconstituted from r301B47R, v3-CHPKmut, and v3-CHPKmutR were measured and the results are shown as box-and-whisker plots. Statistically significant differences between the different viruses were determined with Kruskal–Wallis tests (one-way non-parametric ANOVA), followed by multiple comparison tests. There was a significant difference (p = 0.001) between v301B47R and v-3CHPKmut using an independent samples Kruskal–Wallis test. No significant difference (p = 0.630) was determined between v301B47R, v-3CHPKmut, and v-3CHPKmutR. (b) Multi-step replication kinetics was used to measure virus replication in CEC cultures. The mean fold-change in viral DNA copies over the inoculum is shown for each virus and time point. Except for an effect of significant changes in viral DNA replication over time (T; p = 0.001), there were no differences in virus replication between viruses (V; p = 0.308) or in their interaction (V × T; p = 0.19) (p > 0.05, two-way ANOVA, Tukey, n = 6). (c) Representative plaques for v301B/1, v301B47R, v3-CHPKmut, and v3-CHPKmutR used for plaque size assays are shown. Plaques were stained with polyclonal chicken anti-GaHV-3 antibody and goat anti-chicken-IgY Alexa488 (green) was used as a secondary antibody to identify plaques. Fluorescent expression of mRFP (red) was directly visualized and cells were counterstained with Hoechst 33,342 to visualize nuclei. (d) Representative plaques for v301B/1, v301B47R, v3-CHPKmut, and v3-CHPKmutR were stained with monoclonal mouse anti-gB IgG1 antibody (Y5.9) and goat anti-mouse-IgG Alexa488 (green) was used as a secondary antibody to show 301B/1 specificity of plaques. Fluorescent expression of mRFP (red) was directly visualized and cells were counterstained with Hoechst 33,342 to visualize nuclei. Scale bars represent 200 µm.

