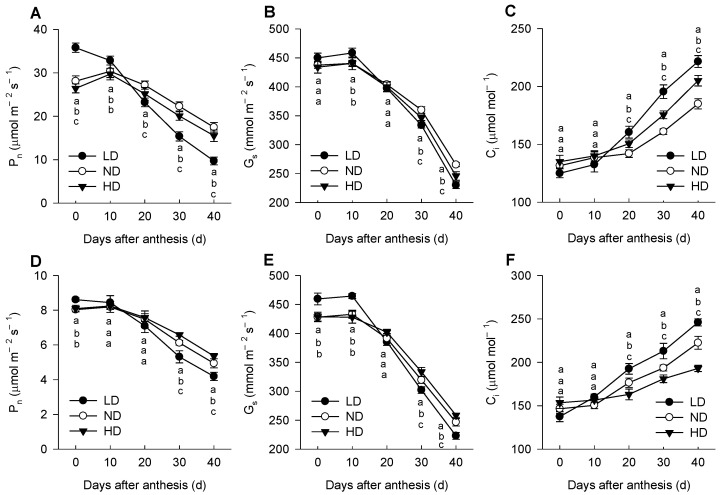
Figure 2.
Changes in net photosynthetic rate (Pn, (A,D)), stomatal conductance (Gs, (B,E)), and intercellular CO2 concentration (Ci, (C,F)) of maize leaves under high-light (HL, 1600 μmol m−2 s−1; (A–C)) and low-light (LL, 300 μmol m−2 s−1; (D–F)) conditions. Means ± SD, n = 5. Different lowercase letters (a, b, c) denote statistical differences by LSD test (p ≤ 0.05) between different treatments. LD, low density; ND, normal density; HD, high density.

