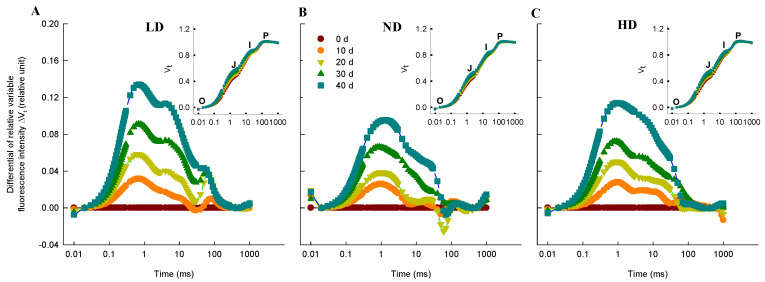
Figure 3.
Chlorophyll a fluorescence (ChlF) induction transient curves of maize leaves. (A–C) Effects of planting density ((A), low density, LD; (B), normal density, ND; (C), high density, HD) on differential plots of relative ChlF (ΔVt = (Ft − Fo)/(Fm − Fo) − Vt,0d) in the leaves of maize at 0, 10, 20, 30, and 40 d after anthesis. For ΔVt analysis, the fluorescence of leaves at 0 d after anthesis was used as a reference and set to 0. For the insert plot in (A–C), the chlorophyll a fluorescence (ChlF) transient OJIP kinetics curves, O, J, I, and P, represent the fluorescence intensity at 20 μs, 2 ms, 30 ms, and 500 ms, respectively. Values are means (n = 9).

