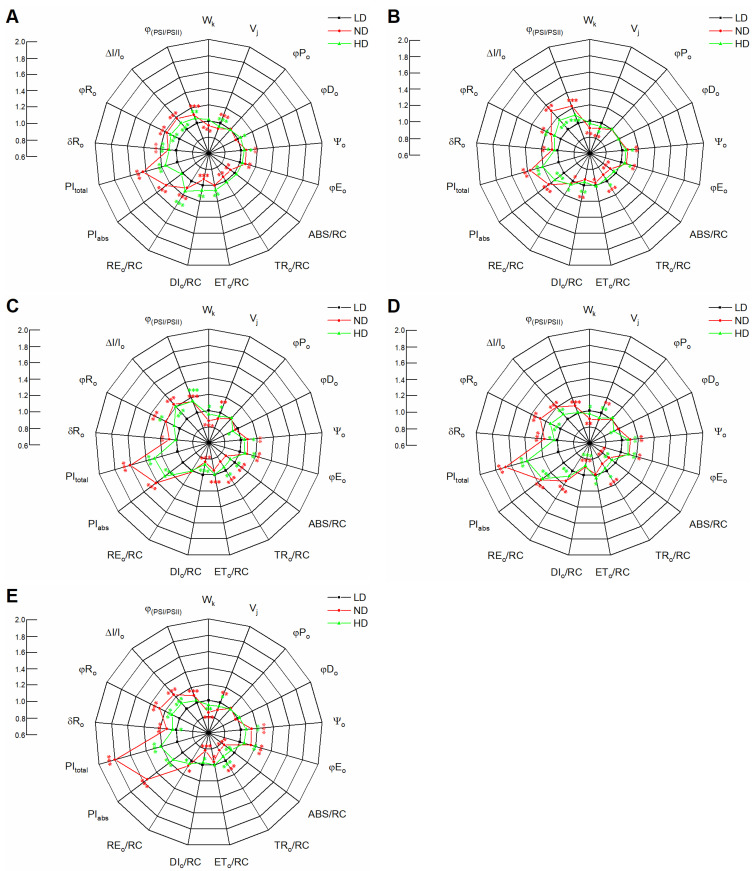
Figure 5.
Spider plots showing changes in JIP-test parameters in maize leaves planted in low density (LD), normal density (ND), and high density (HD) and measured at 0 (A), 10 (B), 20 (C), 30 (D), and 40 d (E) after anthesis. Values are means (n = 9). Asterisks (*, **, and ***) denote significant differences between different planting densities according to Fisher’s LSD test at p ≤ 0.05, p ≤ 0.01, and p ≤ 0.001, respectively. Significant differences between low and normal (red) or high (green) density treatment are denoted by asterisks of different colors.

