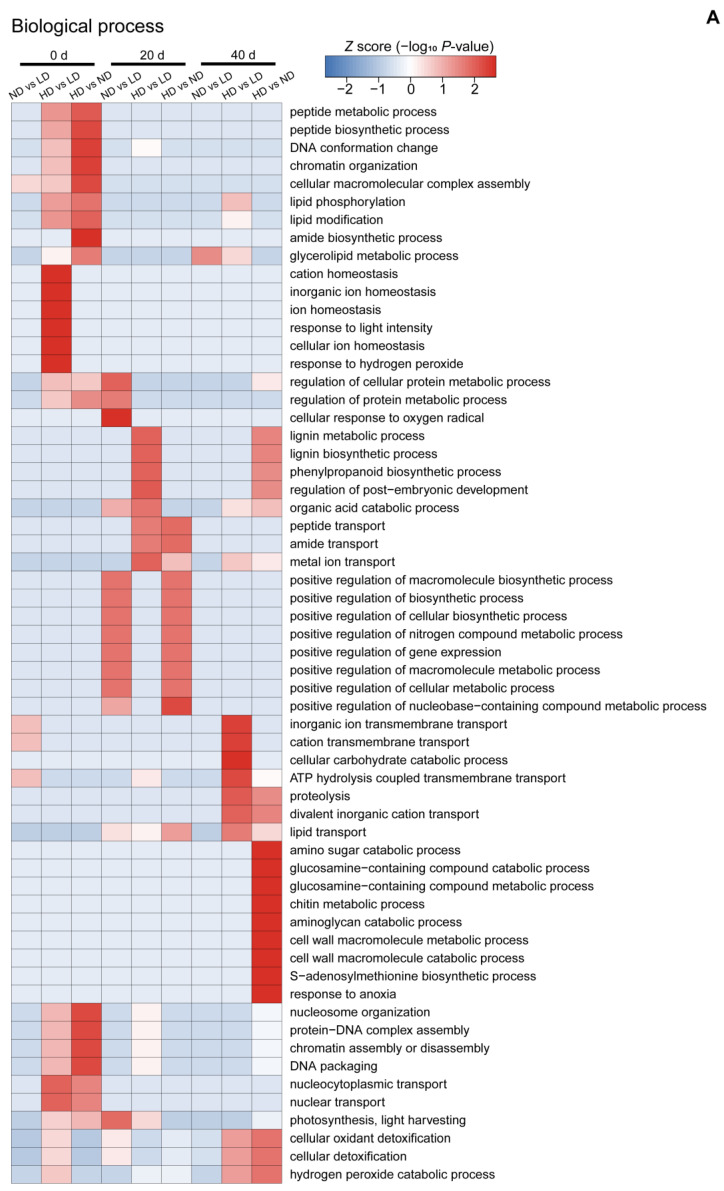
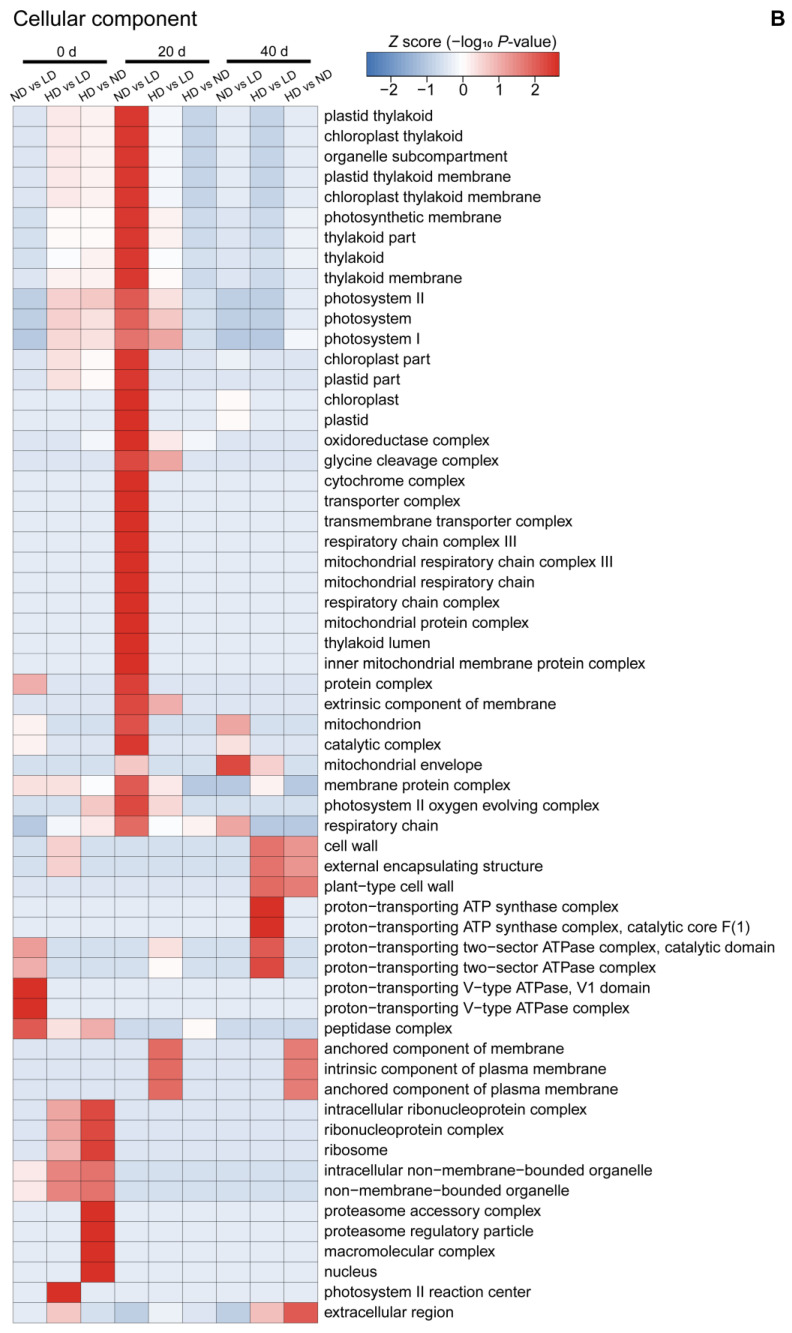
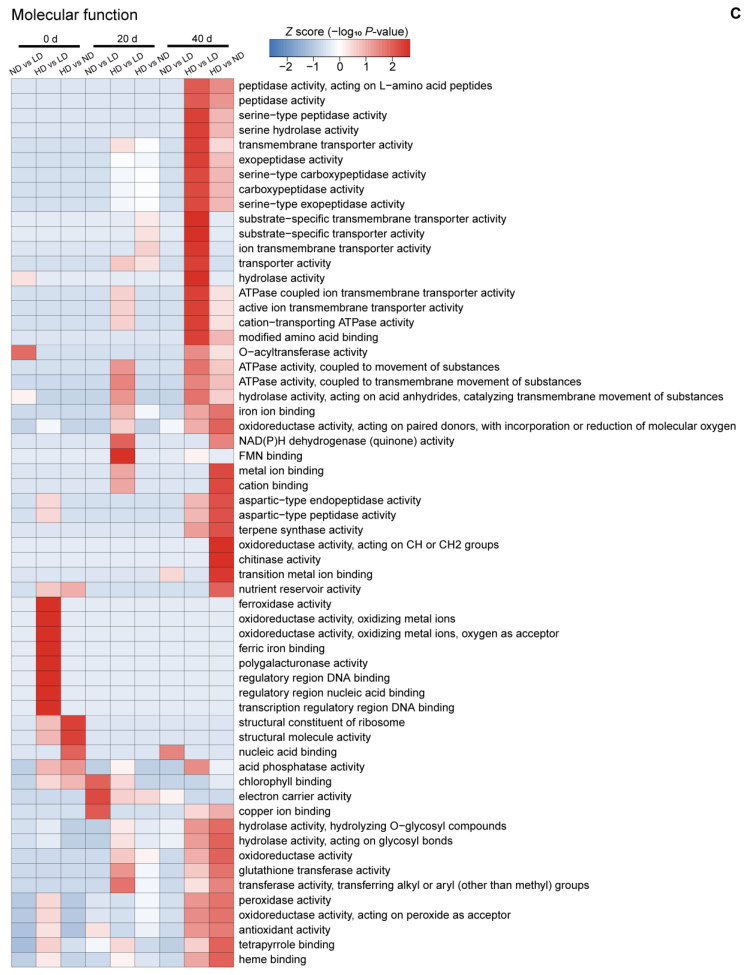
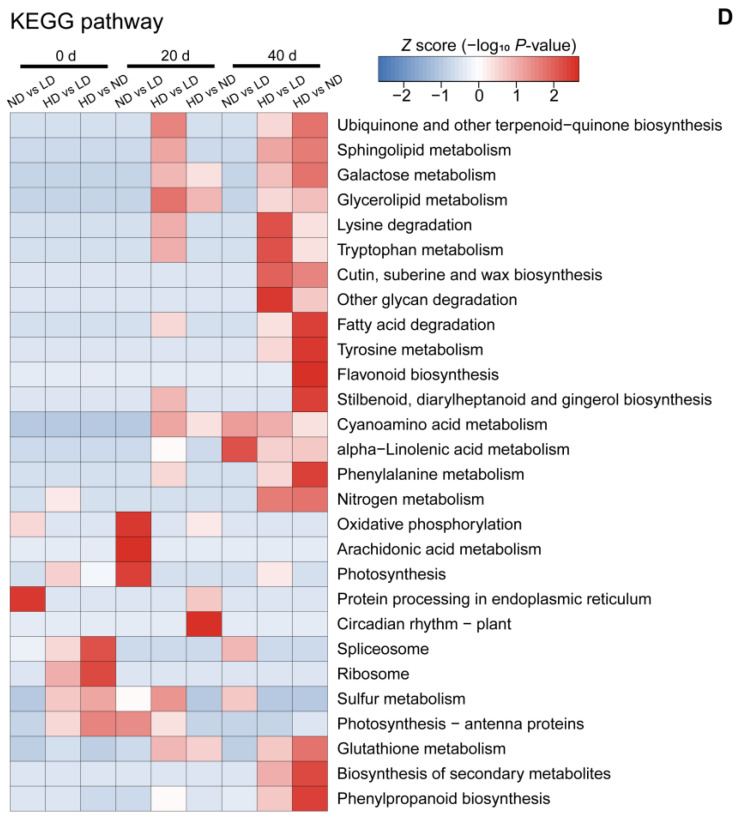
Figure 7.
Heatmaps obtained from GO and KEGG pathway analysis comparing the differentially abundant protein (DAP) expression patterns under different conditions. (A) Biological process analysis; (B) cellular component analysis; (C) molecular function analysis; and (D) KEGG pathway analysis. Colored scales of the Z score (–log10 p-value) are shown; proteins that accumulated at high levels are in red, and proteins with low accumulation levels are in blue. LD, low density; ND, normal density; HD, high density; 0, 20, and 40 d, days after anthesis.


