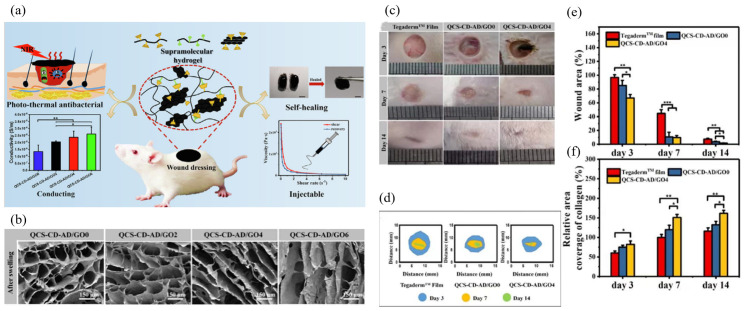
Figure 9.
(a) Schematic diagram of hydrogel properties. (b) SEM of hydrogels after swelling. Scale bar: 150 μm. (c) Photographs of wounds on the 3rd, 7th, and 14th days for TegadermTM film dressing, QCS-CD-AD/GO0 and QCS-CD-AD/GO4 hydrogels. (d) Schematic diagram of wound area during 14 days for the three groups. (e) Statistics of the wound area in each group (n = 5). (f) The statistical results of relative area coverage of collagen in the regenerated tissue, data for the group of TegadermTM film on the 7th day were set as 100% (n = 5). * p < 0.05, ** p < 0.01. The QCS-CD-AD/GO hydrogels with GO-CD contents of 0.2 wt%, 0.4 wt%, and 0.6 wt% in the hydrogel were named QCS-CD-AD/GO2, QCS-CD-AD/GO4, and QCS-CD-AD/GO6, respectively. Data reproduced with permission from Ref. [79].

