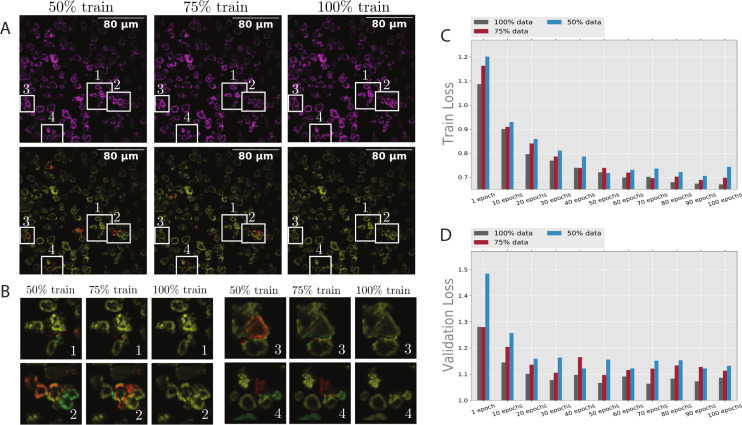
Fig 5. The comparison of the model’s loss with different sets of training data.
(A) Represents a test image sample in the evaluation phase using the defined trained networks. In (B), four different zoomed areas are selected for analysis. Images with similar numbers point to the same boxes in (A). These images present the effect of having access to more training data and its role in removing discrepancies. (C) Shows the training loss, and (D) Shows the validation loss from 0 to 100 training iterations with 100% of the training data. As expected, the training loss shows a more predictable pattern than validation loss.

