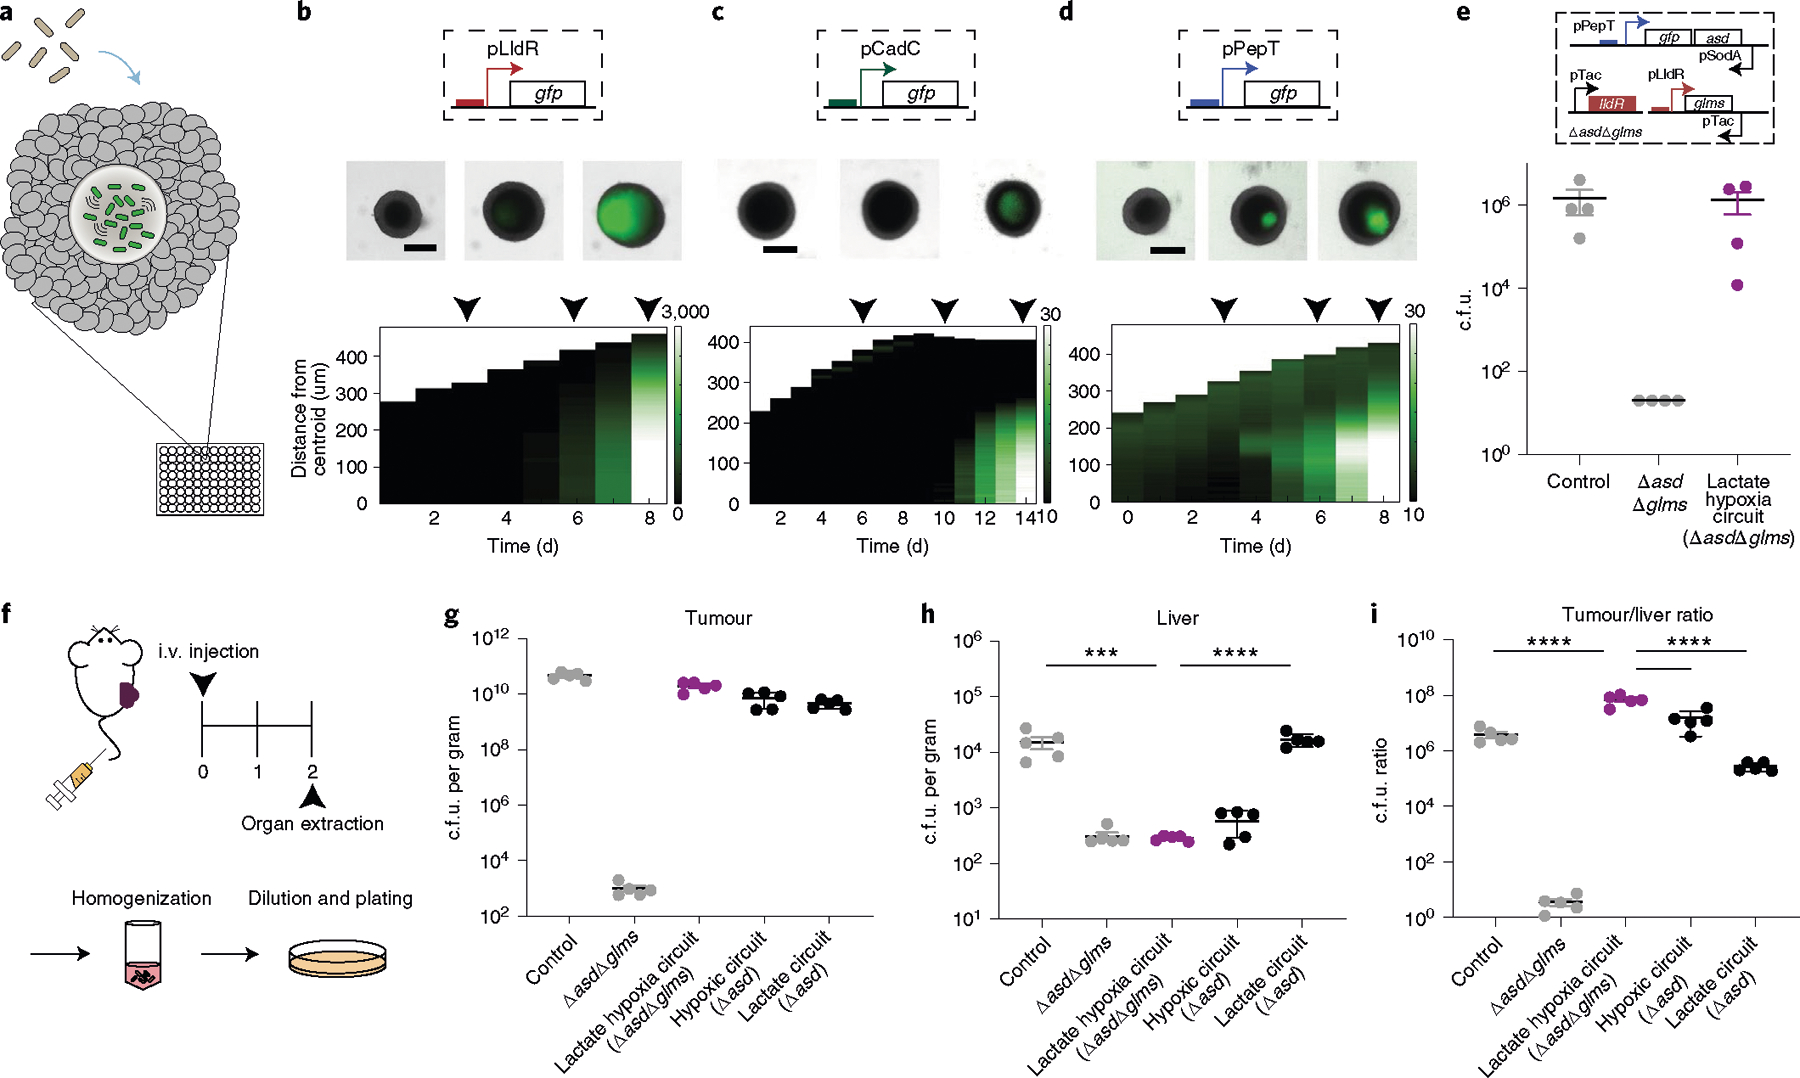
Fig. 5 |. The multiplexed biosensor achieves enhanced specificity of bacteria tumour colonization.

a, Engineered bacterial biosensors were cocultured in tumour spheroids and monitored for biosensor activation. b–d, Top: representative images of biosensors in tumour spheroids from n = 3 biological replicates (see Supplementary Fig. 19 for replicates). The black arrows indicate the day that the image was taken (top). Scale bars, 200 μm. Bottom: corresponding space–time diagram demonstrating radially averaged fluorescence intensity of lactate (pTC1908) (b), pH (pTC037) (c) and hypoxia (pPepT) (d) biosensors. The white boundary indicates the edge of the spheroid. e, Recovered colony counts of control strain S. Typhimurium ELH1301, ELH1301 ΔasdΔglms and the hypoxia–lactate circuit tested in tumour spheroid technology. All strains were cocultured in spheroids for 6 d, after which the spheroid was homogenized and the samples were plated on LB agar plates. n = 3 biological replicates. Data are mean ± s.e.m. LOD, 20 c.f.u. f, BALB/c mice (n = 5 per group) were implanted subcutaneously with 5 × 10⁶ CT26 cells in one hind flank. When the tumour volumes were 100–150 mm3, the mice were intravenously administered with ELH1301 (control), double knockout ELH1301 (ΔasdΔglms), the lactate–hypoxia circuit in ΔasdΔglms, hypoxic only (Δasd) or lactate only (Δasd) ELH1301. After 2 d, the tumour, liver and spleen were homogenized and plated on LB agar plates with supplements. i.v., intravenous. g,h, Bacteria colonizing tumour (g) and liver (h) tissues were quantified and counted after 1 d. n = 5 biological replicates. Data are mean ± s.e.m. Statistical analysis was performed using one-way ANOVA with Bonferroni’s multiple-comparisons test; ****P < 0.0001, ***P = 0.0002. Tumour and spleen LOD, 103 c.f.u. per gram; liver LOD, 102 c.f.u. per gram. i, The tumour:liver ratio of bacterial c.f.u. per gram was calculated on the basis of recovered c.f.u. from extracted organs. n = 5 biological replicates. Data are mean ± s.e.m. Statistical analysis was performed using one-way ANOVA with Bonferroni’s multiple-comparisons test; ****P < 0.0001. Tumour LOD, 103 c.f.u. per gram; liver LOD, 102 c.f.u. per gram.
