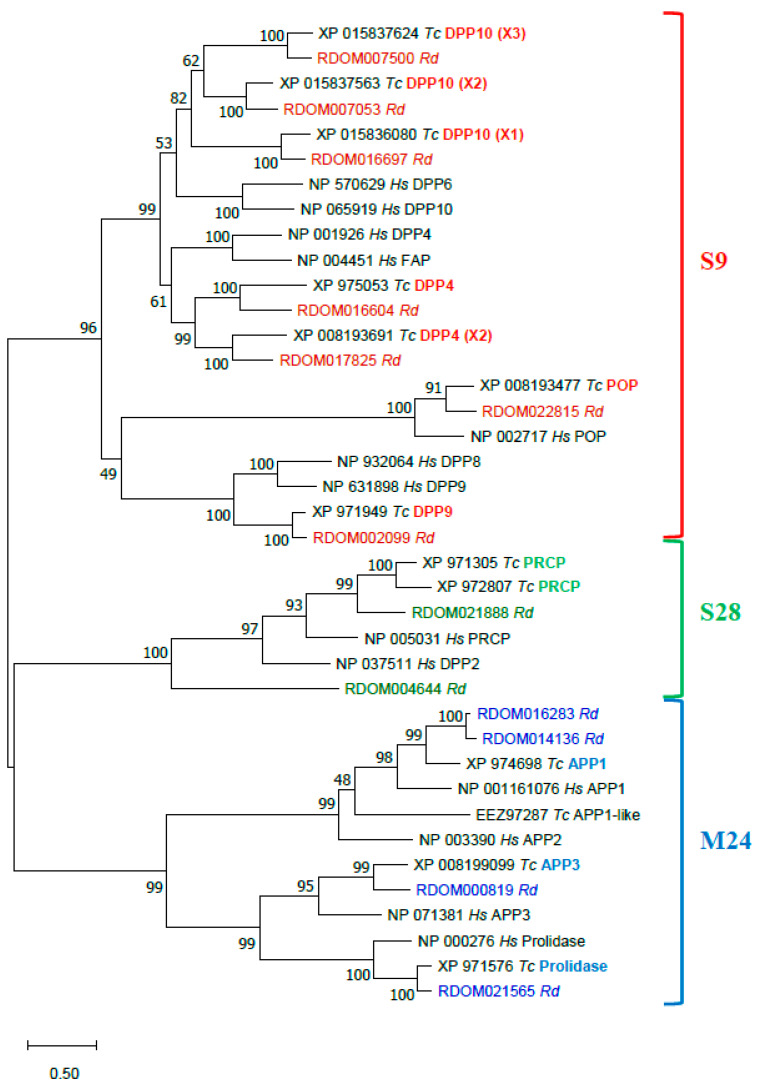
Figure 7.
Phylogenetic analysis of R. dominica, T. castaneum, and H. sapiens PSPs. Maximum Likelihood trees with 500 iterations of bootstrapping were used; bootstrapping values are represented as a percentage (0–100) by each branch. Evolutionary distances are represented by branch’s length. Serine PSPs of S9 family are colored with red, S28 with green, and metallopeptidases of M24 with blue. Types of peptidases (on the example of T. castaneum) are indicated in bold with corresponding color; X1, X2, X3—mean isoforms of one type. R. dominica sequences are colored according to the family.

