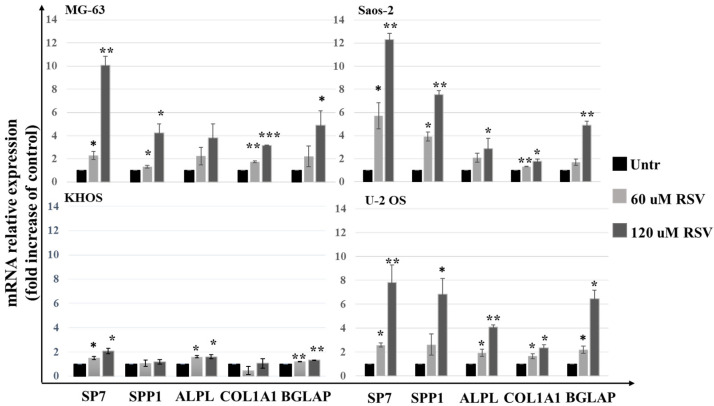
Figure 4.
Evaluation of OS cell lines differentiation after RSV treatment in 48 h. qPCR analysis was performed to study the mRNA expression levels of osteoblast differentiation genes. Each bar graph shows the increase in the expression expressed in FOI compared to the control (Untreated). Gene expression analysis was performed using the 2−ΔΔCT method using β-actin expression as the reference gene (mean ± SD, n = 4). A one-way ANOVA test was used to evaluate the effect of the RSV treatment factor (60 or 120 µM) on OS cell line differentiation. Dunnett’s test: *, p < 0.05; **, p < 0.005; ***, p < 0.0005 versus untreated cell culture.

