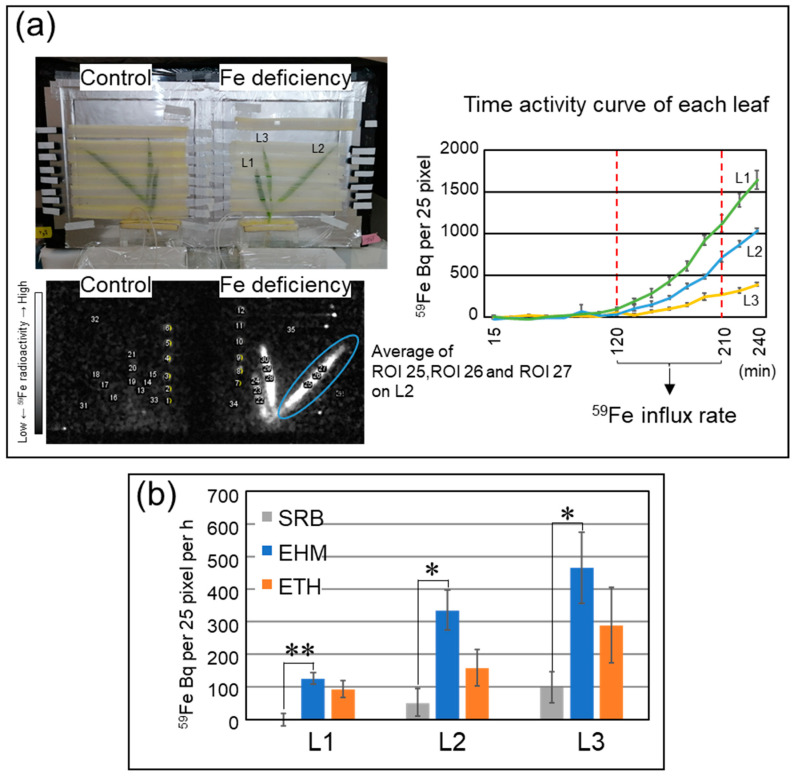
Figure 3.
59Fe influx rate of Fe-deficient leaves detected by live-autoradiography. (a) Scheme for calculation of 59Fe influx rate to leaves. Three regions of interest (ROIs) of 16 mm2 (4 mm × 4 mm = 5 × 5 pixels) were set for each leaf, and average values of the three ROIs were calculated. Time–activity curves (TACs) for 59Fe Bq per 16 mm2 of each leaf were then generated. 59Fe influx rate was calculated from the increase of radioactivity during a time window (120–210 min) when activity was linearly increased. (b) 59Fe influx rate of each leaf was measured using three plants of each cultivar. Each TAC is represented in Figure S2. Only Fe-deficient leaves are represented, since the 59Fe influx rates of control leaves were slow and sometimes undetectable. Gray bars, SRB; blue bars, EHM; orange bars, ETH. * p < 0.05 and ** p < 0.01 indicate significant differences (according to Student’s t-test) between the two cultivars.

