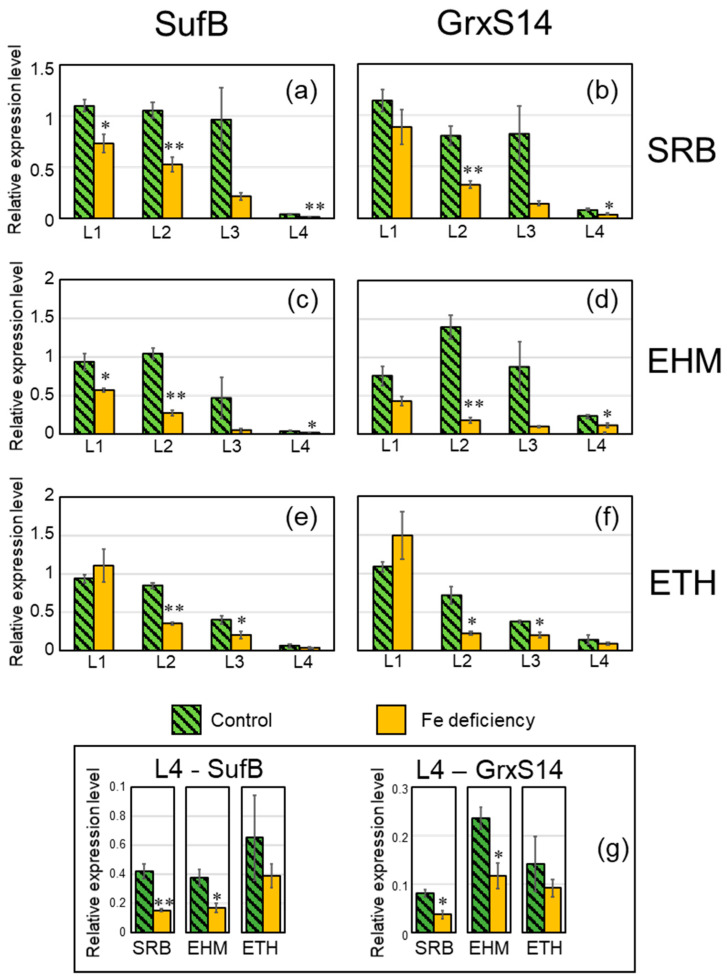
Figure 4.
Downregulation of SUFB and GrxS14 at day four after the onset of Fe depletion. Relative expression values were obtained from qRT-PCR performed on total cDNA of leaf samples collected from the same plants as those of Figure 1. Each sample of the three biological replicates was subjected to triplicate experiments, and expression levels of SUFB and GrxS14 were normalized against those of EF-1α and actin. Error bars indicate the standard error of the three biological replicates. * p < 0.05 and ** p < 0.01 indicate significant differences (according to Student’s t-test) between the control leaf and Fe-deficient leaf. (a,b) SRB, (c,d) EHM, and (e,f) ETH. (a,c,e) SUFB and (b,d,f) GrxS14. Enlarged L4 data are shown in panel (g).

