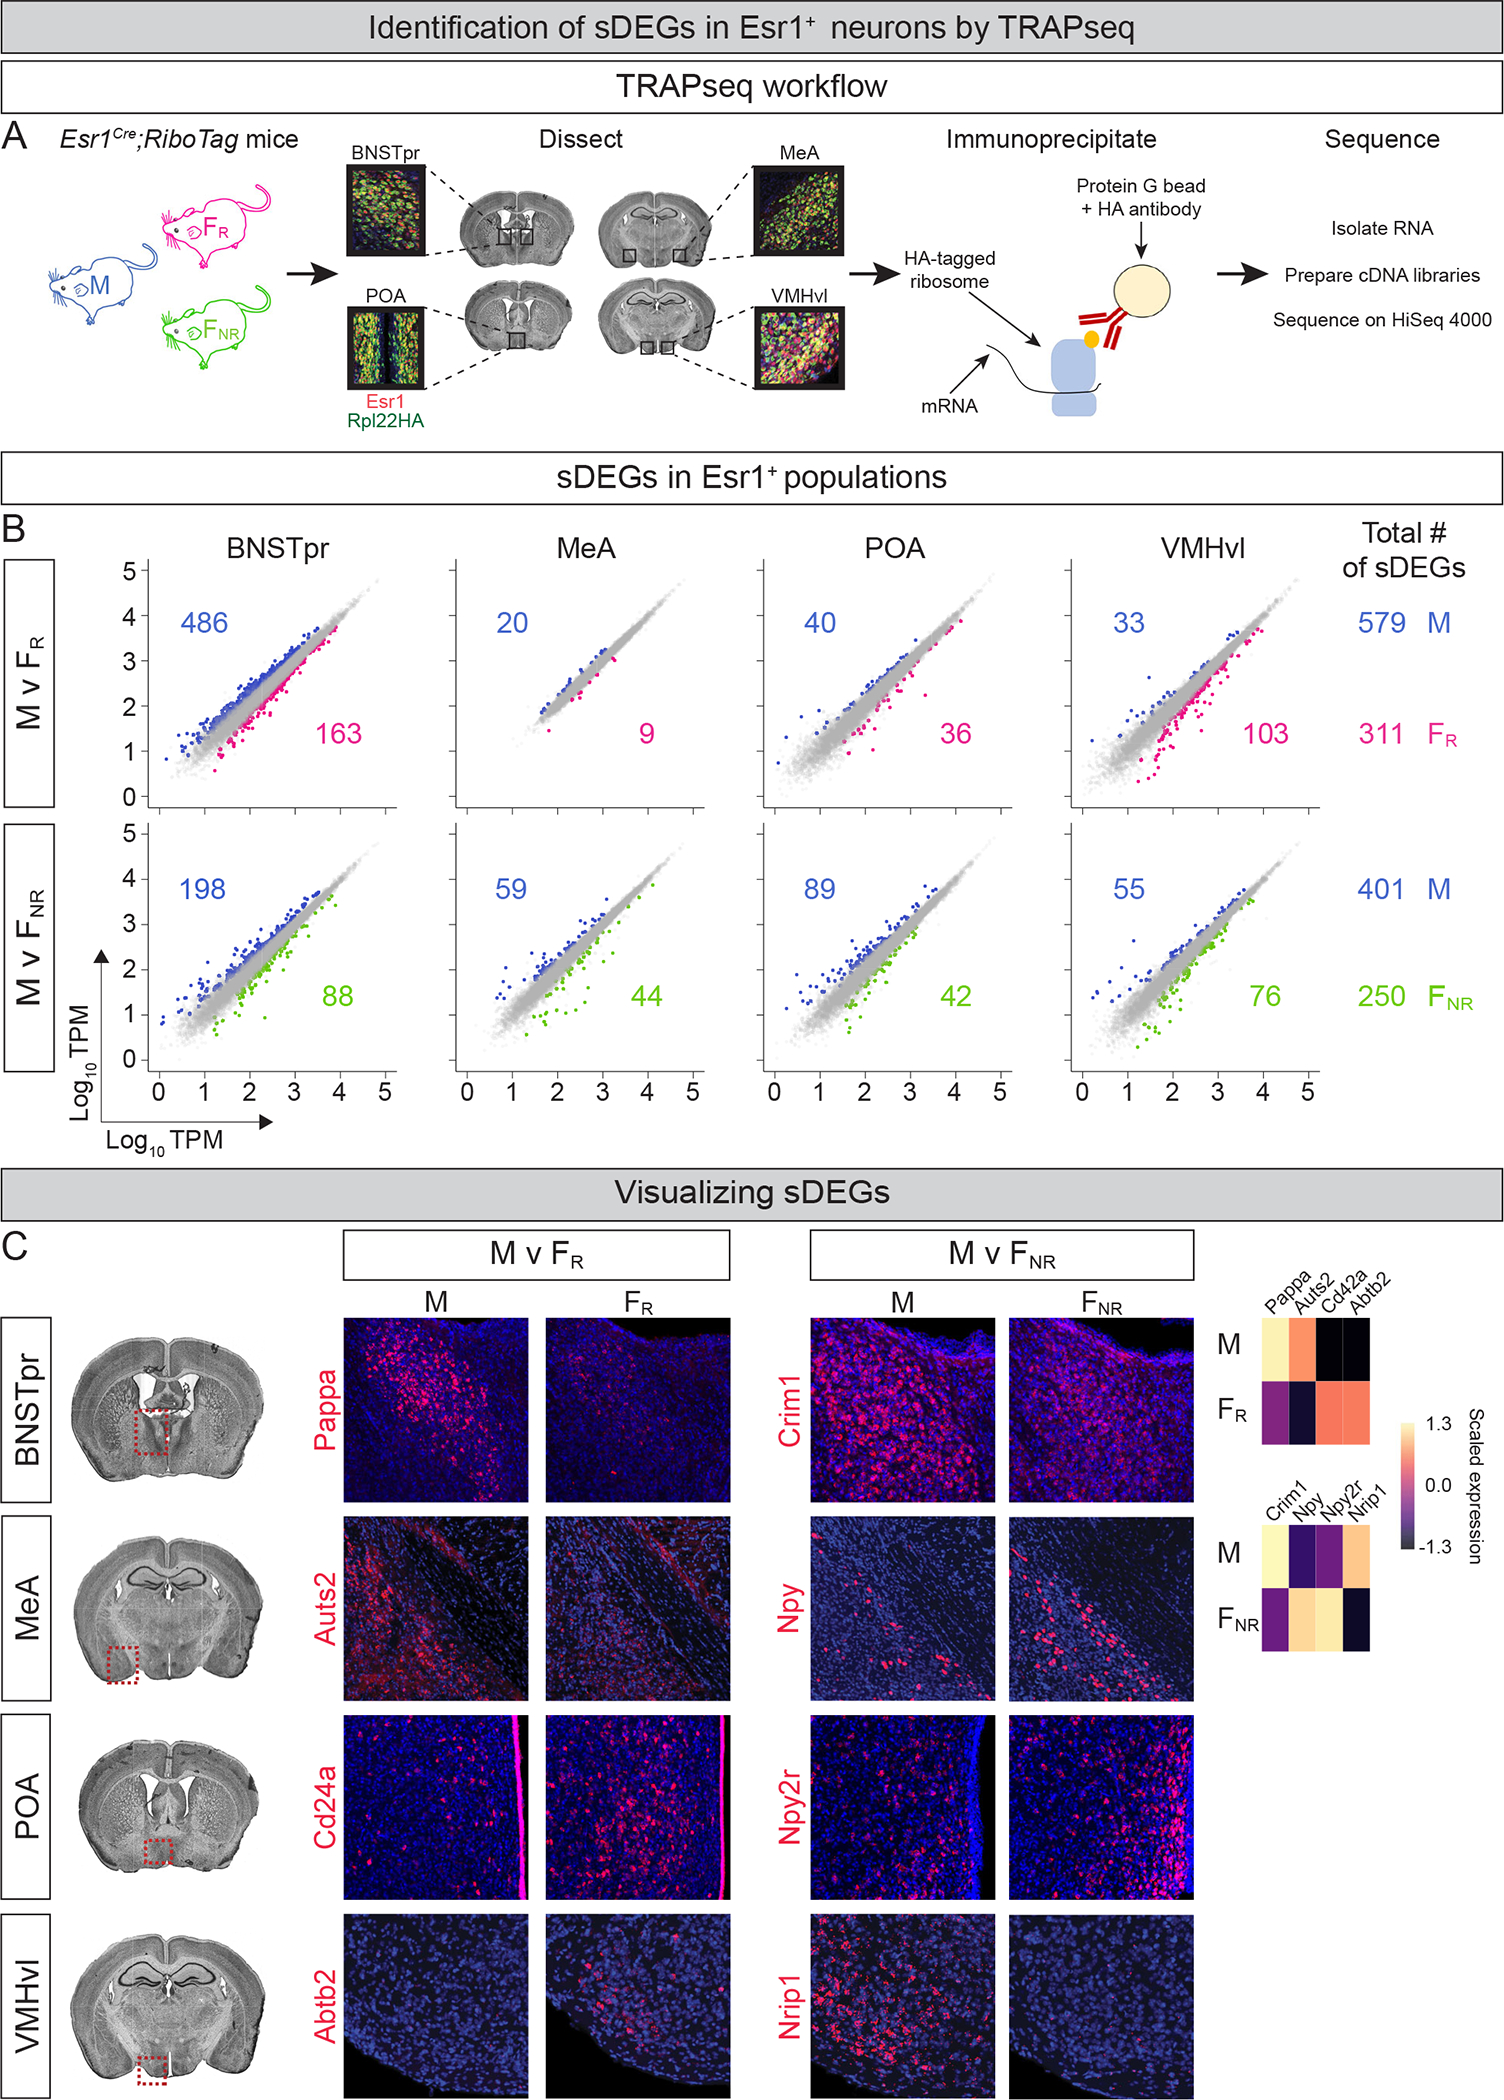
Figure 1: TRAPseq identification of sex differences in gene expression.

A. Schematic of TRAPseq workflow.
B. Scatter plots of sDEGs in different Esr1+ populations. Dots represent DEGs with >1.5-fold change and FDR-adjusted p value < 0.05 (colored) or genes that did not meet both criteria (gray). Colored numbers show number of sDEGs upregulated in that condition and comparison for each region and (far right) for all regions combined. In total, TRAPseq identified 890 and 651 sDEGs in M v FR and M v FNR comparisons. v, versus; TPM, transcripts/million. n = 3/condition.
C. ISH for sDEGs in coronal sections through regions enclosed within red dotted areas on Nissl-stained sections on left. ISHs confirm TRAPseq data showing higher expression of Pappa, Auts2, Criml, and Nripl in M and other genes upregulated in FR or FNR mice. Heatmap at far right shows scaled expression of DEGs that were visualized by ISH. Scale = mean z-scored expression of DEGs centered at zero for individual comparisons between conditions (sex or estrous state) and regions; analogous heatmaps provided for ISH studies in all figures. Coronal plane as well as dorsoventral and mediolateral orientations preserved for histological panels in all figures. n = 2/condition/probe. Red, mRNA; blue, DAPI. Scale bars = 100 μm.
See also Fig. S1.
