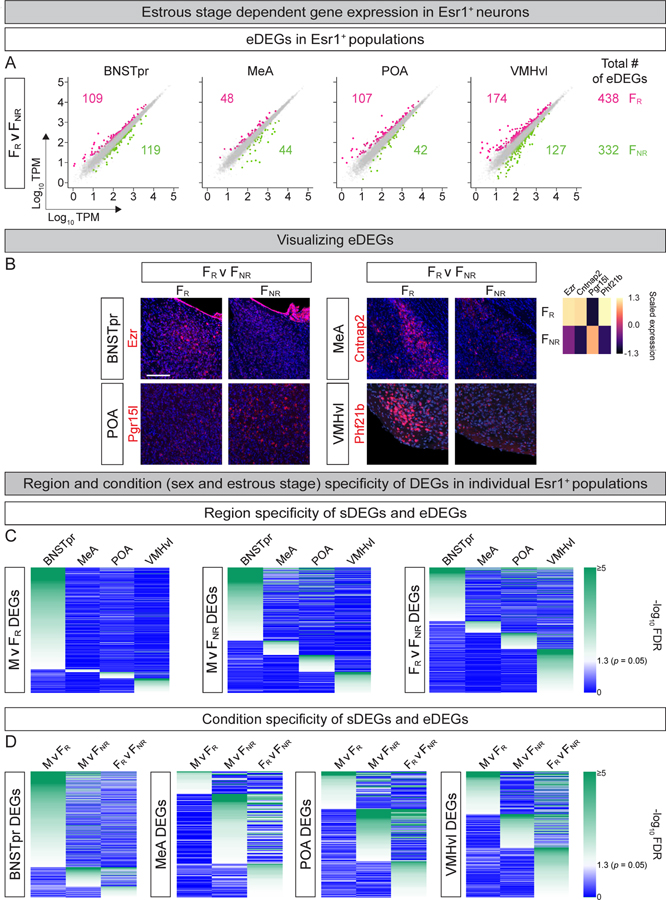
Figure 2: TRAPseq identification of estrous stage-dependent differences in gene expression.
A. Scatter plots of eDEGs in different Esr1+ populations. Dots represent DEGs with >1.5-fold change and FDR-adjusted p value < 0.05 (colored) or genes that did not meet both criteria (gray). Colored numbers show number of eDEGs upregulated in that condition and comparison for each region and (far right) for all regions combined. In total, TRAPseq identified 770 eDEGs. n = 3.
B. ISH for eDEGs. ISHs confirm TRAPseq data showing higher expression of Pgr15l in FNR and other genes upregulated in FR mice. n = 2/condition/probe. Scale bars = 100 μm.
C. Heatmap of p values of individual DEGs for the relevant pairwise comparison (with darker green colors indicating more significant p values) illustrating that most DEGs are restricted to one Esr1+ population.
D. Heatmap of p values of individual DEGs for the relevant pairwise comparison (with darker green colors indicating more significant p values) illustrating that most DEGs within an Esr1+ population are specific to one comparison between sexes or estrous states.
See also Fig. S2.

