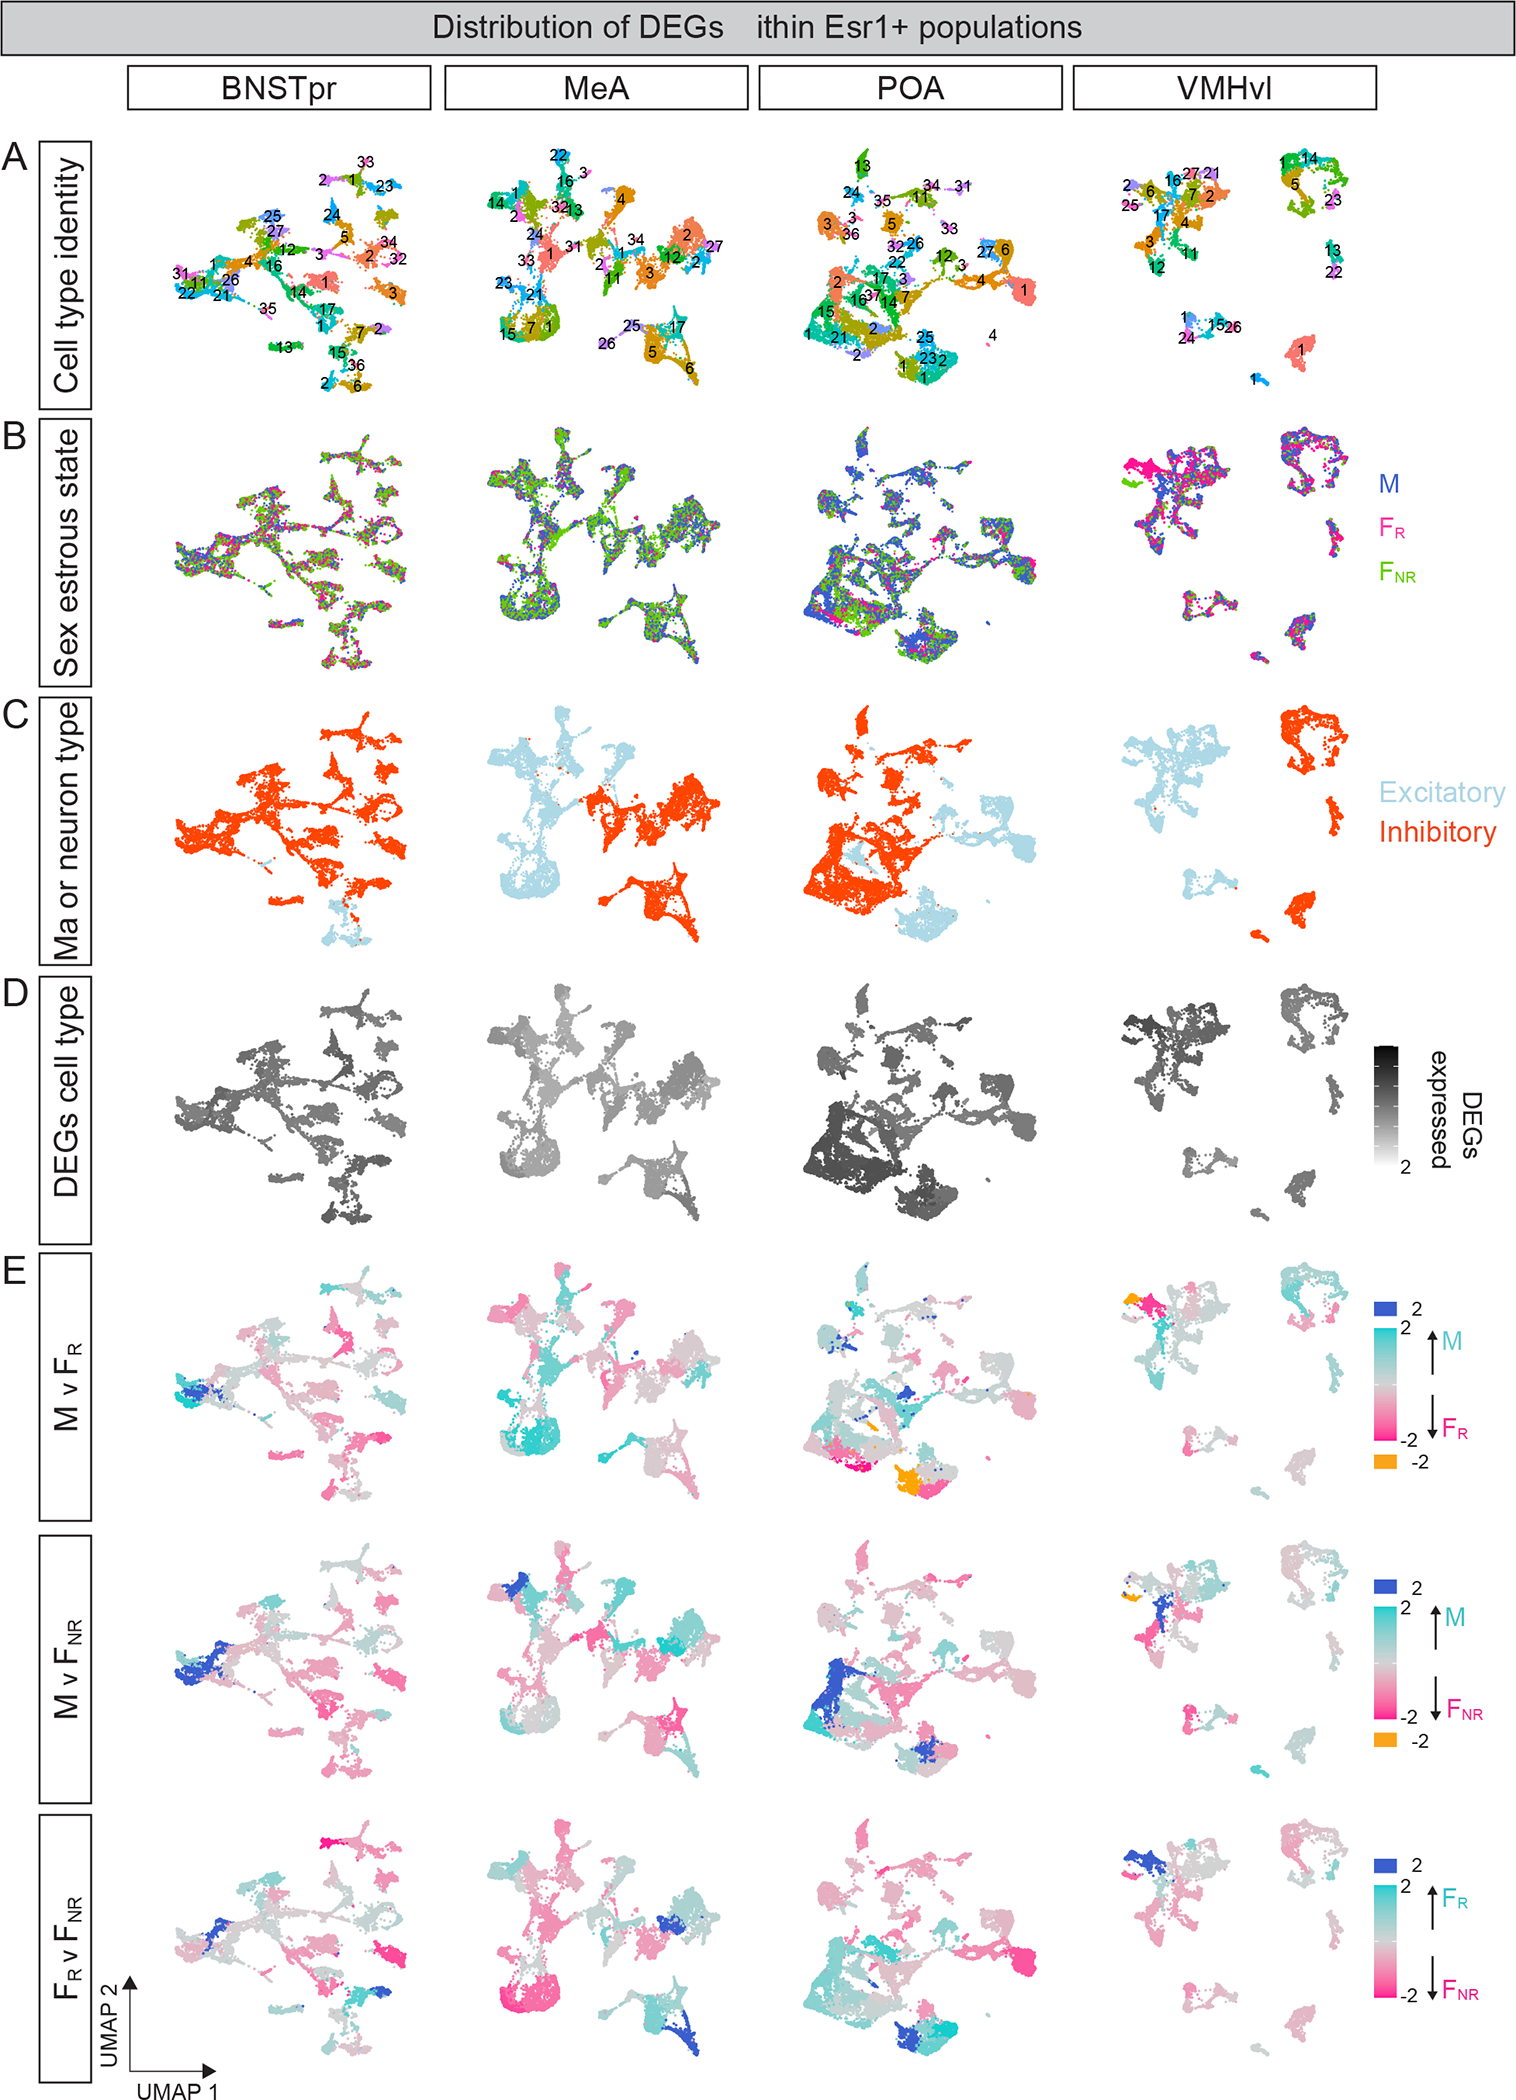
Figure 5: Distributive representation of DEGs across Esr1+ cell types.

A. UMAP representation of cell types in Esr1+ populations, with numbers corresponding to those in Fig. 4.
B. UMAP representation of Esr1+ cell types by sex or estrous state shows that most of them are proportionally equivalently distributed.
C. UMAP representation of excitatory and inhibitory cell types.
D. UMAP representation shows that each cell type expresses ≥20% of DEGs in the respective Esr1+ population.
E. UMAP representation with scaled distribution of DEGs. Individual cell types express both sDEGs and eDEGs, with different cell types expressing proportionally more DEGs upregulated in a given condition (sex or estrous stage). Gray cell types (scaled value = “0”) express equivalent proportion of DEGs upregulated in both conditions being compared.
