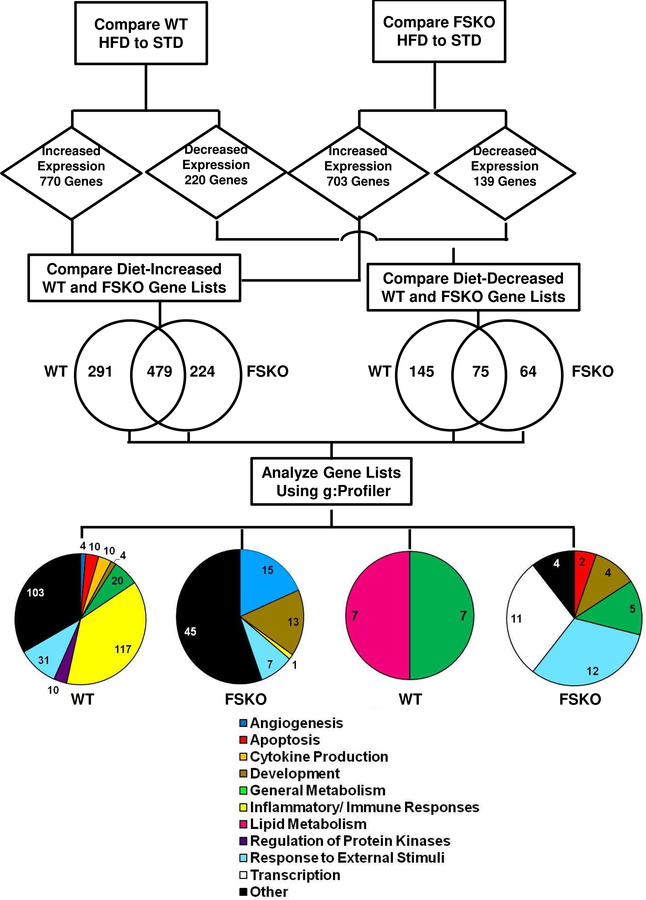
Figure 5. Work-Flow Diagram for the Analysis of RNA-Seq Data in IWAT.
Differential gene expression analysis was used to compare RNA-Seq data in IWAT adipocytes from WT STD versus HFD mice and from FSKO STD versus HFD mice. Genes that were significantly increased or decreased according to the criteria outlined in Methods, were identified for each genotype. The gene lists were compared, and genes that were unique to each genotype were subjected to pathway analysis using g:Profiler. Pie charts depict the numbers of gene ontology pathways in the indicated categories.

