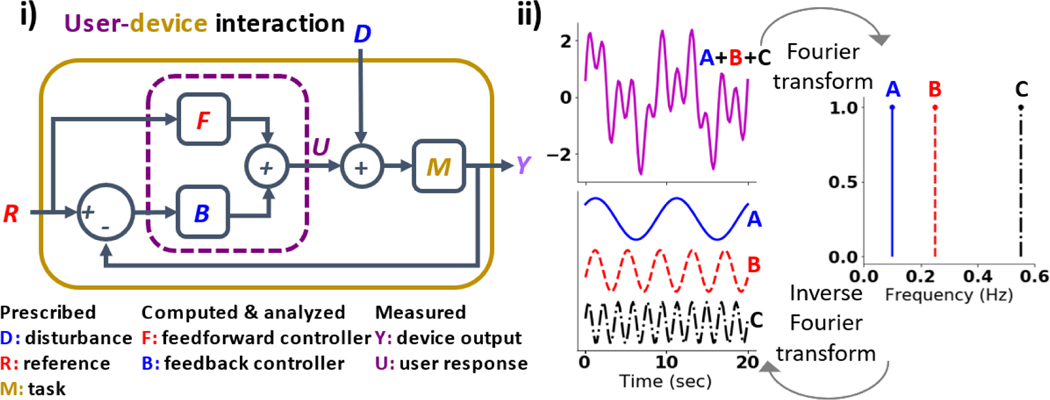
Figure 2.
(i) Block diagram representation of user interacting with device adapted from [27]. The user, contained within the purple dotted square, transforms external reference R and tracking error R − Y through feedforward (user intent, F in red) and feedback (error correction, B in blue) controllers to produce user input U. The device transforms the sum of user input U and external disturbance D to device output Y via mapping M. (ii) Signals in the time-domain (left top graph) can be considered as a sum of many sine waves at different frequencies (left bottom graph). These sinusoidal waves can be difficult to separate in the time-domain (left), but easy to separate in the frequency domain (right). The Fourier transform is used to convert time-domain signals to frequency-domain signals. It is a linear operator that represents time-domain signals using a linear combination of sinuisoids [3].

