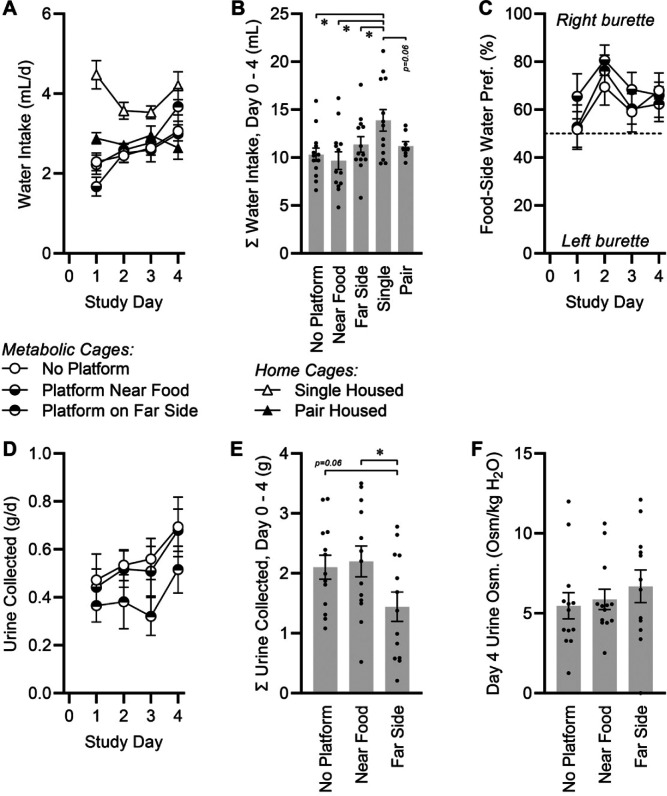
Figure 3.
Fluid balance effects of caging conditions. (A) Water intake per day. Two-way RM ANOVA caging P < 0.0001, day P = 0.0004, cage x day P < 0.0001. (B) Cumulative water intake, day 0 to day 4. One-way ANOVA P = 0.0115. (C) Fraction of water consumed from bottle located closer to food source. Two-way RM ANOVA caging P = 0.3774, day P = 0.0192, cage x day P = 0.9381. All groups P < 0.05 compared with 50% by one-sample t test. (D) Urine collected per day. Two-way RM ANOVA caging P = 0.1630, day P = 0.0182, cage x day P = 0.9517. (E) Cumulative urine collected, day 0 to day 4. One-way ANOVA P = 0.0605. (F) Osmolality of urine collected on day 4. One-way ANOVA P = 0.5843. For all panels, no platform n = 14, near food n = 14, far side n = 14, single n = 13, paired n = 16. Summary data presented as mean± SE; *P < 0.05 by Fisher LSD.

