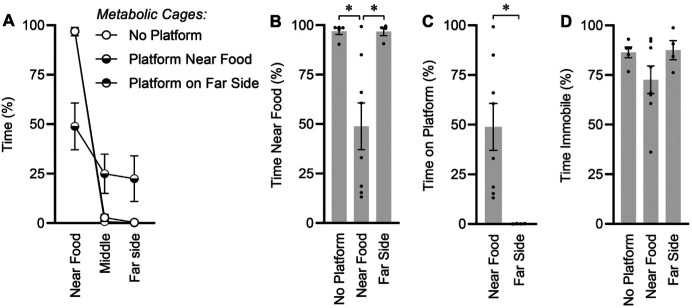
Figure 4.
Behavioral analysis during last 4 h of light phase. (A) Distribution of time spent in fractions of cage near the food source, in the middle of the cage, or on the far side of the cage. Note that the “Platform on far side” group almost completely overlaps and is therefore visually obscured by the “No platform” group. (B) Time spent near food source. One-way ANOVA P = 0.0037. (C) Time spent on platform. Independent t test P = 0.0174. (D) Total immobile time. One-way ANOVA P = 0.1770. For all panels, no platform n = 5, near food n = 8, far side n = 4. Summary data presented as mean± SE; *P < 0.05 by Fisher LSD.

